 English
  Русский
 Bahasa Indonesia
 Bahasa Malay
 ไทย
ไทย Español
 Deutsch
 Български
 Français
 Tiếng Việt
 中文
中文 বাংলা
বাংলা हिन्दी
 Čeština
 Українська
 Română

The pair was moving upwards on Monday after the bears lost momentum and tested 34 average EMA at 1.1084 (purple thin line). Today, the downward movement is possible. On Tuesday, important economic data is due to be released at 10:00 GMT (Euro), 12:30 and 14:00 GMT (dollar).
Trend analysis (pic. 1).
On Tuesday, the market will stay in bearish territory with the target at 1.1056 and retracement level of 61.8% (blue dashed line). If this level is reached, the pair will continue the downward movement with the next target at 1.1001 which is the historical level of support (blue dashed line).
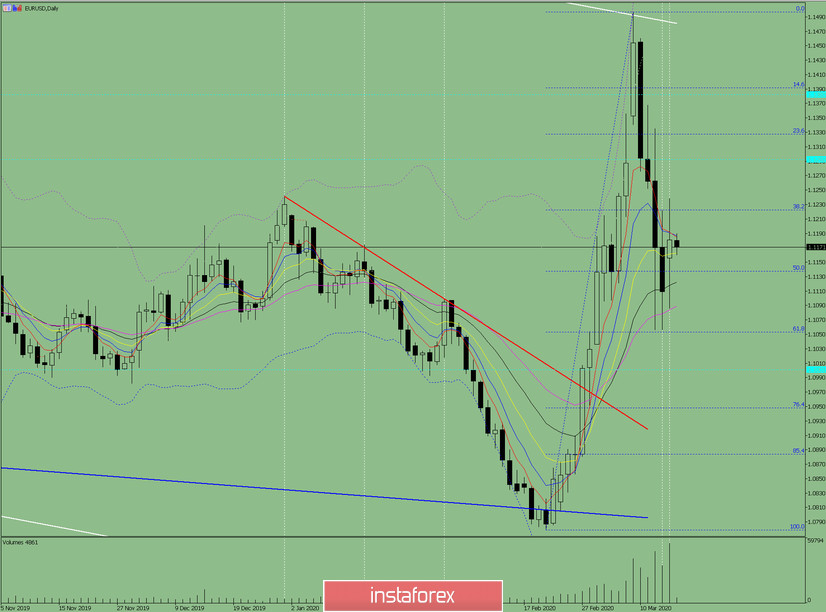
Pic. 1 (daily chart).
Complex analysis:
- indicator analysis - down;
- Fibonacci levels - down;
- volumes - down;
- candlestick analysis - up;
- trend analysis - down;
- Bollinger bands - down;
- weekly chart - down.
Conclusion:
Today, the pair is seen to move downwards from the level of 1.1181 (yesterday's candlestick close) and can continue to retreat until the first target of 1.1056 is reached with a retracement level of 61.8% (blue dashed line).
Another scenario (less likely): the pair can face an upward trend after hitting the level of 1.1181 (yesterday's candlestick close) with a target at 1.1238 - the up fractal (blue dashed line).