 English
  Русский
 Bahasa Indonesia
 Bahasa Malay
 ไทย
ไทย Español
 Deutsch
 Български
 Français
 Tiếng Việt
 中文
中文 বাংলা
বাংলা हिन्दी
 Čeština
 Українська
 Română

The pair continued to move upward on Thursday, testing a pullback level of 50.0% - 1.1067 (red dashed line). Today, the upward movement will continue. There is still high volatility in the market. Strong calendar news is not expected today.
Trend analysis (Fig. 1).
Today, from the level of 1.1031 (closing of yesterday's candle) the price will try to continue to move up with the target of 1.1168, a retracement level of 61.8% (red dashed line). If this level is reached, the downward movement will continue with the target of 1.0961, a retracement level of 23.6.% (Blue dashed line).
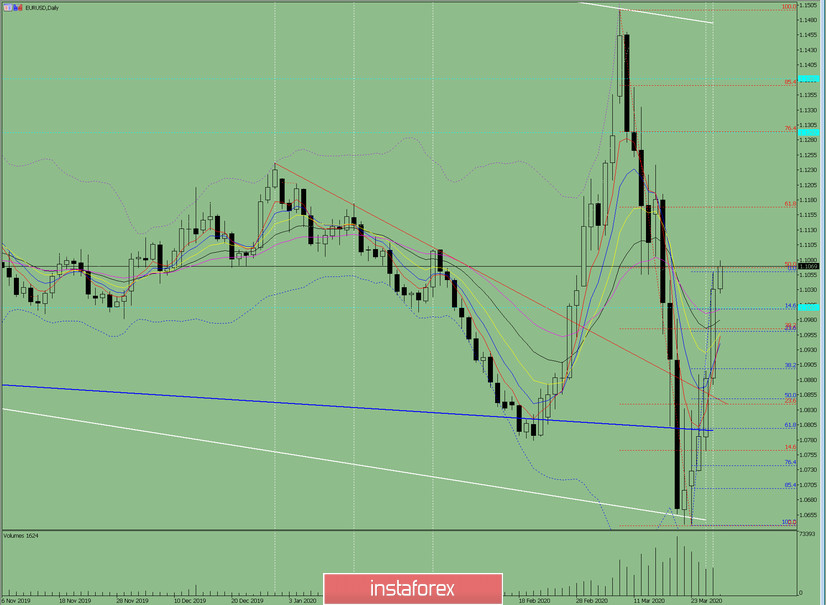
Fig. 1 (daily chart).
Comprehensive analysis:
- Indicator analysis - up;
- Fibonacci levels - up;
- Volumes - up;
- Candlestick analysis - down;
- Trend analysis - up;
- Bollinger Lines - up;
- Weekly schedule - up.
General conclusion:
Today, the price will try to continue to move up.
An unlikely scenario: from a retracement level of 61.8% - 1.1168 (red dashed line) work up, with a target of 1.1293, a retracement level of 76.4% (red dashed line).