 English
  Русский
 Bahasa Indonesia
 Bahasa Malay
 ไทย
ไทย Español
 Deutsch
 Български
 Français
 Tiếng Việt
 中文
中文 বাংলা
বাংলা हिन्दी
 Čeština
 Українська
 Română

After breaking through the support line 1.0791 (red bold line), the pair went on an upward pullback movement. Upon moving up, the price tested the pullback level of 38.2% (red dashed line). Today, the market may continue to move up. Strong calendar news for the dollar is expected at 14:30 and 18:00 UTC.
Trend analysis (Fig. 1).
Today, from the pullback level of 23.6% - 1.0858 (red dashed line), the pair may continue to move up with the target of 1.0913 - the pullback level of 38.2% (red dashed line). If this level is reached, the upward work will continue with the target of 1.0958 - a pullback level of 50.0% (red dashed line).
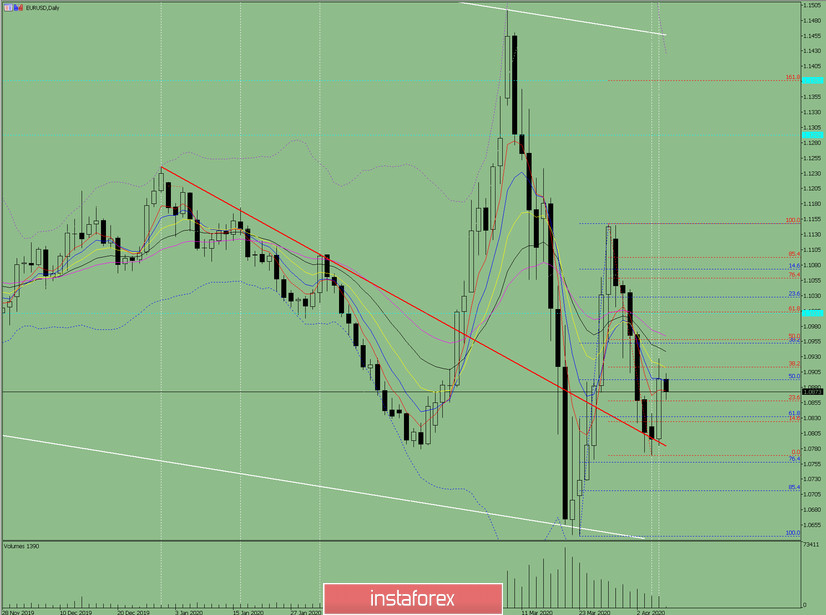
Fig. 1 (daily chart).
Comprehensive analysis:
- Indicator analysis - up;
- Fibonacci levels - up;
- Volumes - up;
- Candlestick analysis - up;
- Trend analysis - up;
- Bollinger lines - down;
- Weekly schedule - up.
General conclusion:
Today, the price may continue to move up with the target at 1.0958 - a pullback level of 50.0% (red dashed line).
An unlikely scenario: from a pullback level of 50.0% - 1.0893 (blue dashed line), work down with the target at the support line 1.0784 (red bold line).