 English
  Русский
 Bahasa Indonesia
 Bahasa Malay
 ไทย
ไทย Español
 Deutsch
 Български
 Français
 Tiếng Việt
 中文
中文 বাংলা
বাংলা हिन्दी
 Čeština
 Українська
 Română

Trend analysis (Fig. 1).
Today, from the level of 1.2418 (closing of the Friday afternoon candle) the pair will try to break through the upper fractal 1.2485 (blue dashed line) and if it succeeds, it will continue to move up with the target of 1.2518 - a retracement level of 61.8% (red dashed line). If this level is reached, the upward work will continue with a target of 1.2779 - a retracement level of 76.4% (red dashed line). This will be the target over the week.
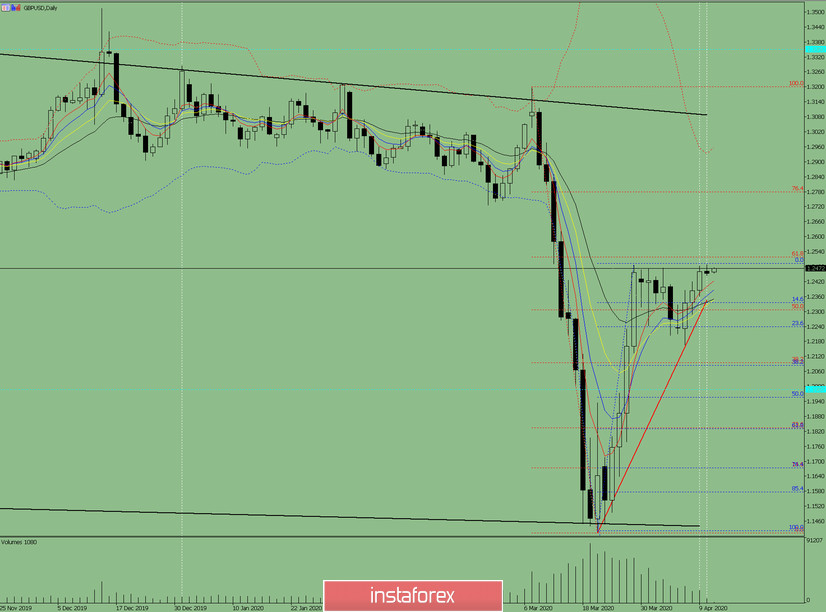
Fig. 1 (daily chart).
Comprehensive analysis:
- Indicator analysis - up;
- Fibonacci levels - up;
- Volumes - up;
- Candlestick analysis - down;
- Trend analysis - up;
- Bollinger Lines - up;
- Weekly schedule - up.
General conclusion:
Today the price will continue its upward movement with the target at 1.2518 - a retracement level of 61.8% (red dashed line).
An unlikely scenario: from the upper fractal 1.2485 (blue dashed line), work down with the target of 1.2238 - a retracement level of 23.6% (blue dashed line).