 English
  Русский
 Bahasa Indonesia
 Bahasa Malay
 ไทย
ไทย Español
 Deutsch
 Български
 Français
 Tiếng Việt
 中文
中文 বাংলা
বাংলা हिन्दी
 Čeština
 Українська
 Română

Last week, the EUR / USD pair moved upwards, testing the pullback level of 50.0% - 1.0951 (blue dashed line). This week, it may continue moving upwards, from the level of 1.0933 (closing of the last weekly candle).
Trend analysis.
The price may continue moving upwards this week, targeting the level of 1.1002 - a pullback level of 61.8% (blue dotted line). If it succeeds, price may continue working upwards, up to the next target at 1.1050 - a pullback level of 76.4% (blue dotted line).
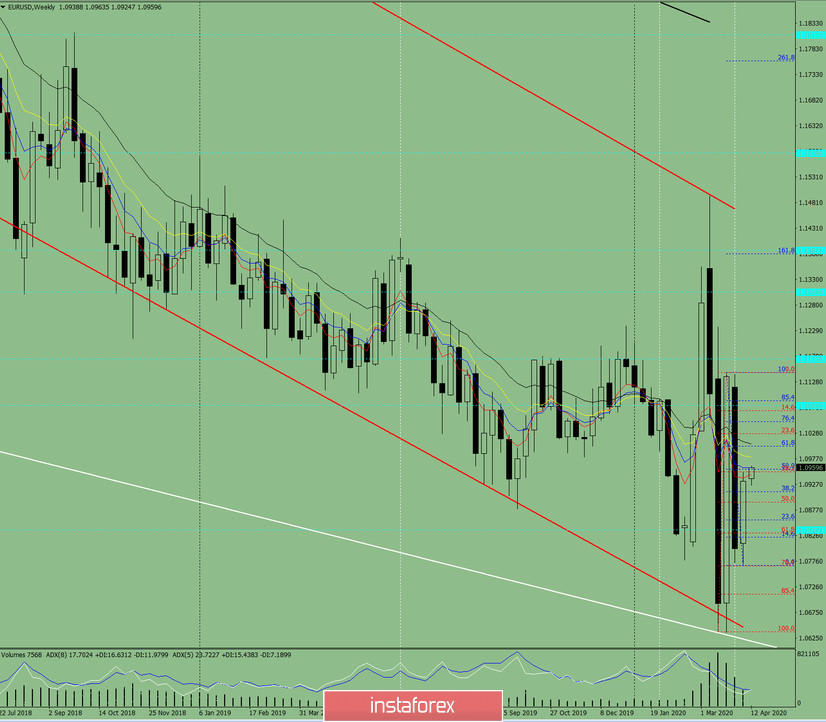
Fig. 1 (weekly schedule).
Integrated analysis:
- indicator analysis - up;
- Fibonacci levels - up;
- volumes - up;
- candlestick analysis - neutral;
- trend analysis - up;
- Bollinger lines - up;
- monthly chart - up.
Conclusion: movement is upward.
Overall result of calculating the EUR / USD candles in the weekly chart: this week, the price of EUR / USD will most likely have an upward trend, with the absence of a lower shadow for the weekly white candlestick (Monday - up), and the absence of a second upper shadow (Friday - up).
An unlikely scenario: movement downwards from 1.0951 (a pullback level of 50.0%, blue dotted line), targeting 1.0767 (pullback level of 76.4%, red dotted line).