 English
  Русский
 Bahasa Indonesia
 Bahasa Malay
 ไทย
ไทย Español
 Deutsch
 Български
 Français
 Tiếng Việt
 中文
中文 বাংলা
বাংলা हिन्दी
 Čeština
 Українська
 Română

Trend analysis (picture 1)
On Tuesday, the pair is trading upwards from the level of 1.0915 where the intraday candle closed yesterday. The target level could be 1.0958 which is 50.0% retracement (it is plotted by the red dotted line). When this level is broken upwards, the price will continue its climb with the target of 1.1003 which is 61.8% retracement (it is plotted by the red dotted line).
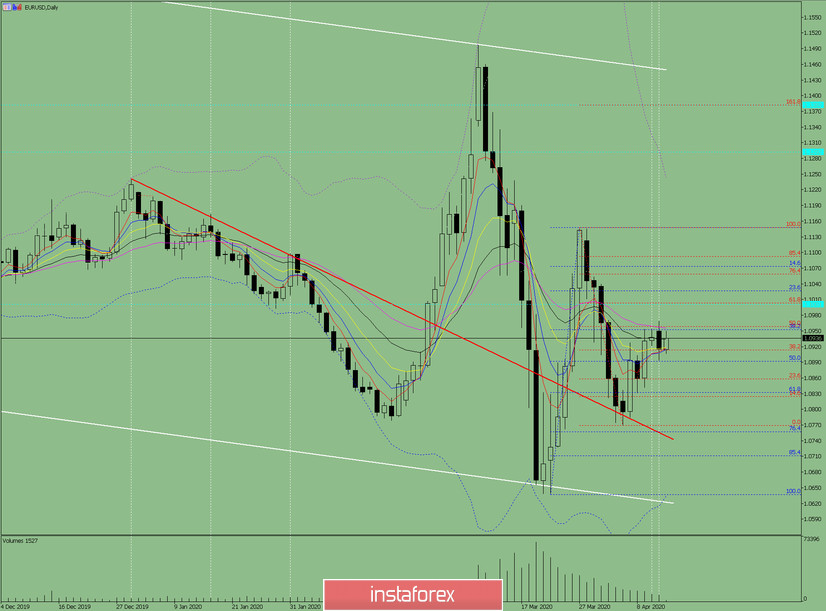
Picture 1 (daily chart)
Complex analysis
- The indicator analysis signals bullish bias
- Fibonacci levels signal bullish bias
- Trade volumes signal bullish bias
- Candlestick analysis signals bullish bias
- Trend analysis signals bullish bias
- Bollinger bands signal bearish move
Conclusion
Today the currency pair is set to continue the bullish move with the target level of 1.1003 which is 61.8% retracement (it is plotted by the red dotted line).
The least probable scenario is the bearish move from 1.0958 which is the 50.0% retracement level (it is plotted by the red dotted line). The second target level could be 1.0893 (it is plotted by the blue dotted line).