 English
  Русский
 Bahasa Indonesia
 Bahasa Malay
 ไทย
ไทย Español
 Deutsch
 Български
 Français
 Tiếng Việt
 中文
中文 বাংলা
বাংলা हिन्दी
 Čeština
 Українська
 Română

Trend analysis (Fig. 1).
Today, from the level of 1.2511 (closing of yesterday's candle) the pair may break through the pullback level 61.8% - 1.2518 (red dashed line). If this attempt becomes successful, the upward movement wi likely to continue with the target of 1.2779 - the pullback level 76.4% (red dashed line).
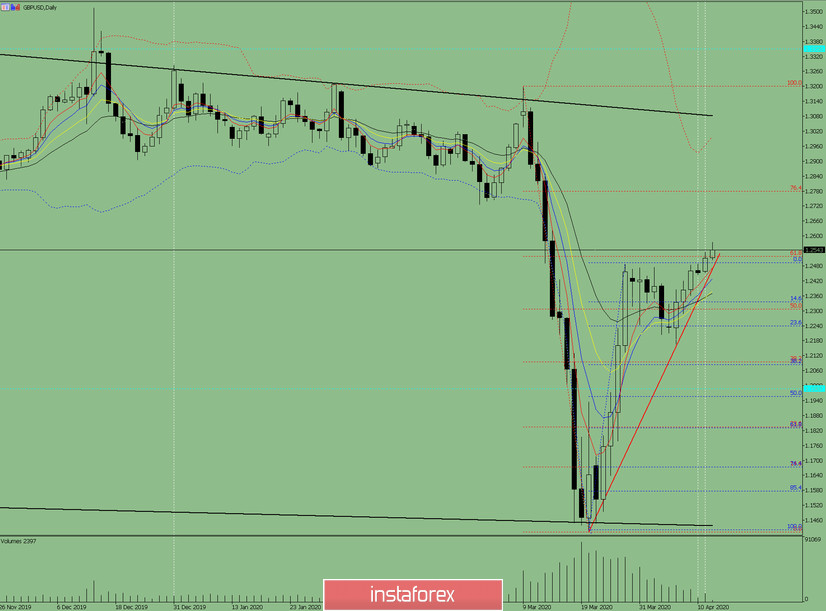
Fig. 1 (daily chart).
Comprehensive analysis:
- Indicator analysis - up;
- Fibonacci levels - up;
- Volumes - up;
- Candlestick analysis - down;
- Trend analysis - up;
- Bollinger Lines - up;
- Weekly schedule - up.
General conclusion:
Today, the price may continue its upward movement with the target at 1.2779 - a retracement level of 76.4% (red dashed line).
Unlikely scenario: from a retracement level of 61.8% - 1.2518 (red dashed line), work down, with a target of 1.2372 - a retracement level of 14.6% (blue dashed line).