 English
  Русский
 Bahasa Indonesia
 Bahasa Malay
 ไทย
ไทย Español
 Deutsch
 Български
 Français
 Tiếng Việt
 中文
中文 বাংলা
বাংলা हिन्दी
 Čeština
 Українська
 Română

Trend analysis (pic. 1).
On Friday, the price is trying to pull back from the support line of 1.2458 (red bold line) and move upwards to the target of 1.2648 which serves as the upper fractal (blue dashed line). If the price breaks through this level, it will continue the uptrend with the target at 1.2779 which serves as a retracement level of 76.4% (red dashed line).
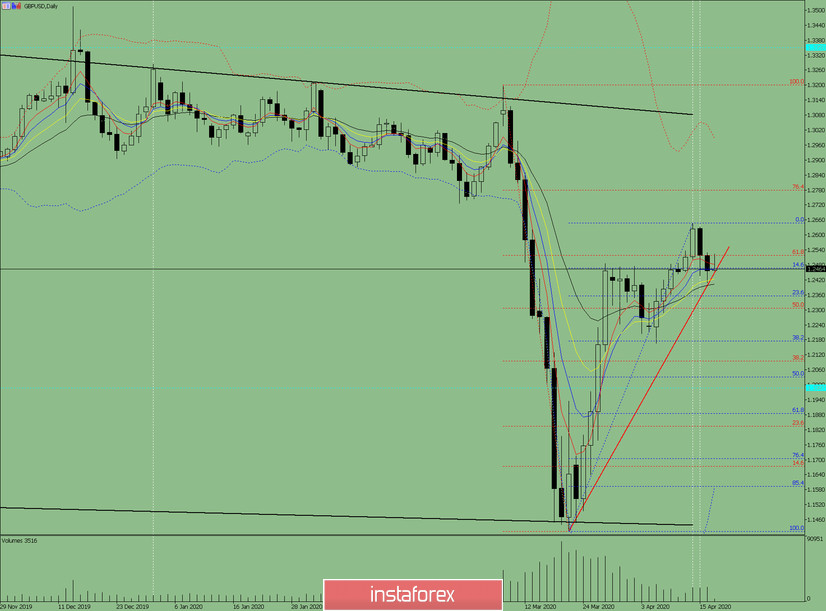
Pic. 1 (daily chart).
Comprehensive analysis:
- indicator analysis - up;
- Fibonacci levels - up;
- volumes - up;
- candlestick analysis - down;
- trend analysis - up;
- Bollinger Lines - up;
- weekly charts - up.
General conclusion:
Today, the price will try to make an upward movement with the target at 1.2648 - the upper fractal (blue dashed line).
Possible scenario: from a retracement level of 61.8% - 1.2520 (red dashed line) the downtrend is possible with a target at 1.2356 - a retracement level of 23.6% (blue dashed line). If the price breaks through this level , the continuation of the downward movement with the target of 1.2175 is very likely with the retracement level of 38.2% (blue dashed line).