 English
  Русский
 Bahasa Indonesia
 Bahasa Malay
 ไทย
ไทย Español
 Deutsch
 Български
 Français
 Tiếng Việt
 中文
中文 বাংলা
বাংলা हिन्दी
 Čeština
 Українська
 Română

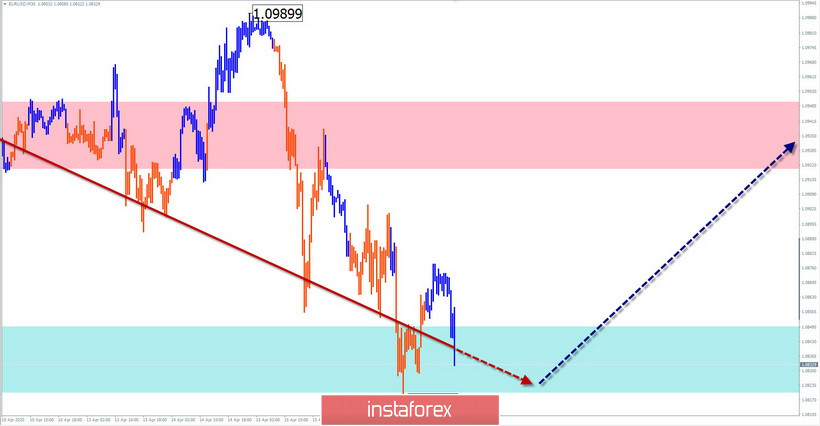
EUR/USD
Analysis:
The direction of the short-term price trend of the European currency is indicated by the upward wave from March 20. The structure of the wave traces the first 2 parts (A-B). The price decline of the last 2 days formed a correction within the final part (C). The upward movement of the end of yesterday has a reversal potential.
Forecast:
In the next trading session, the price is expected to move sideways. There may be pressure on the support zone. In the second half of the day, you can expect a reversal and price growth. Breaking the upper limit of resistance is not excluded today.
Potential reversal zones
Resistance:
- 1.0920/1.0950
Support:
- 1.0850/1.0820
Recommendations:
There are no conditions for selling the euro today. It is recommended to track the reversal signal to buy the tool.
AUD/USD
Analysis:
On the chart of the Australian currency, the upward wave from March 19 sets the trend. The price reached a strong resistance, from which the correction went down. The preliminary calculation indicates its completion at the beginning of the 63rd price figure. There is a clear zigzag in the correction structure.
Forecast:
The general mood of the movement is expected today. In the first half of the day, an upward vector is possible. You can expect the price to turn around and go down by the end of the day.
Potential reversal zones
Resistance:
- 0.6410/0.6450
Support:
- 0.6340/0.6310
Recommendations:
Today, trading on the pair's market is possible only with an intraday trading style, with a reduced lot. In the first half of the day, purchases will be relevant. When reversal signals appear, it is recommended to expand trading positions.
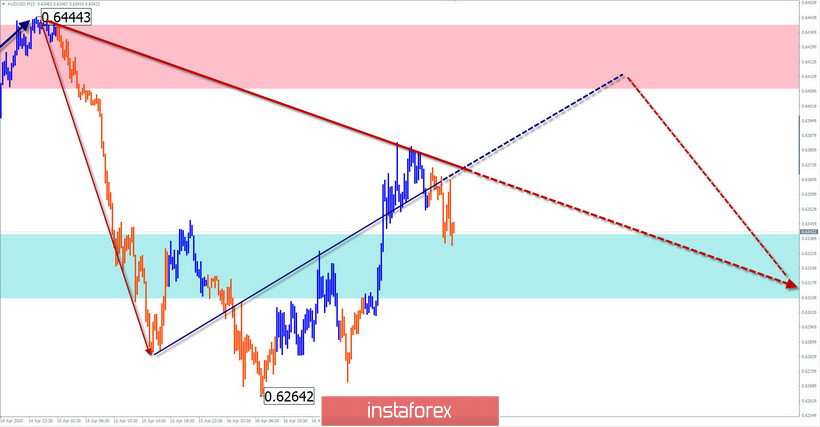
Explanation: In the simplified wave analysis (UVA), waves consist of 3 parts (A-B-C). The last incomplete wave is analyzed. The solid background of arrows shows the formed structure, and the dotted ones show the expected movements.
Note: The wave algorithm does not take into account the duration of the tool movements in time!