 English
  Русский
 Bahasa Indonesia
 Bahasa Malay
 ไทย
ไทย Español
 Deutsch
 Български
 Français
 Tiếng Việt
 中文
中文 বাংলা
বাংলা हिन्दी
 Čeština
 Українська
 Română

Good day, dear traders!
Another cross-rate that we would like to consider today is CAD/CHF. Since no macroeconomic statistics from Canada and Switzerland are expected today, we will immediately proceed to the technical analysis of this currency pair. To complete the picture, let's start with the weekly timeframe.
Weekly
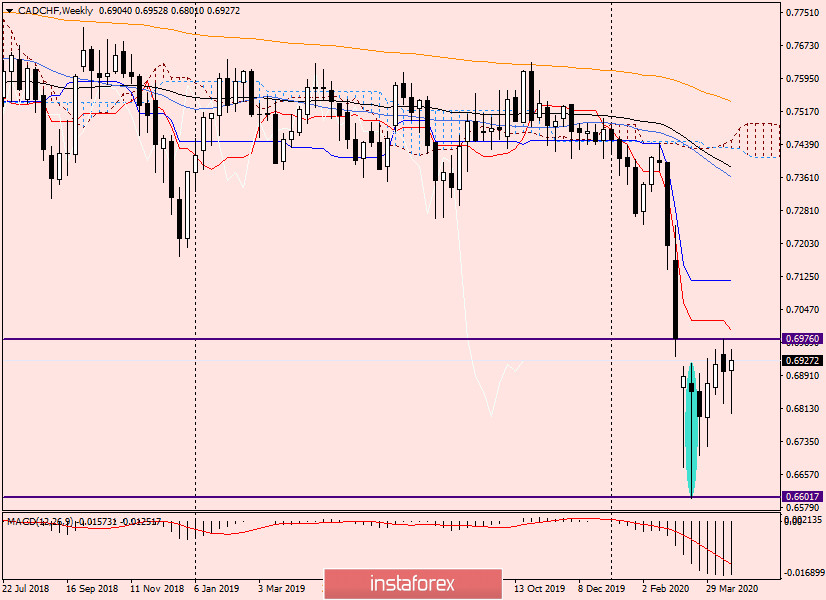
After a fairly strong fall, the pair found support near the important technical and psychological level of 0.6600. As you can see, there was a strong rebound up from here and a highlighted candle with a very long lower shadow was formed, which can be considered a reversal with good reason.
Indeed, the subsequent attempts of the bears on CAD/CHF to continue the pressure were not successful. It was not possible to approach the landmark level of 0.6600 again to test it for a breakdown. However, attempts to grow are still held back by the level of 0.6976, where there is strong resistance from sellers. Given that the Tenkan line of the Ichimoku indicator passes directly under another important level of 0.7000, the resistance zone can be designated as 0.6970-0.7000.
I believe that only the breakdown of the Tenkan line and the closing of weekly trading above the psychological level of 0.7000 will indicate the ability to move further north. At this stage, the rebound and rise of CAD/CHF can be considered a correction to the previous quite strong decline. However, looking at the last few weekly candles, which have quite long lower shadows, we can not exclude that this is a reversal of the pair. Apparently, the market does not want to continue the decline and will move up.
Daily
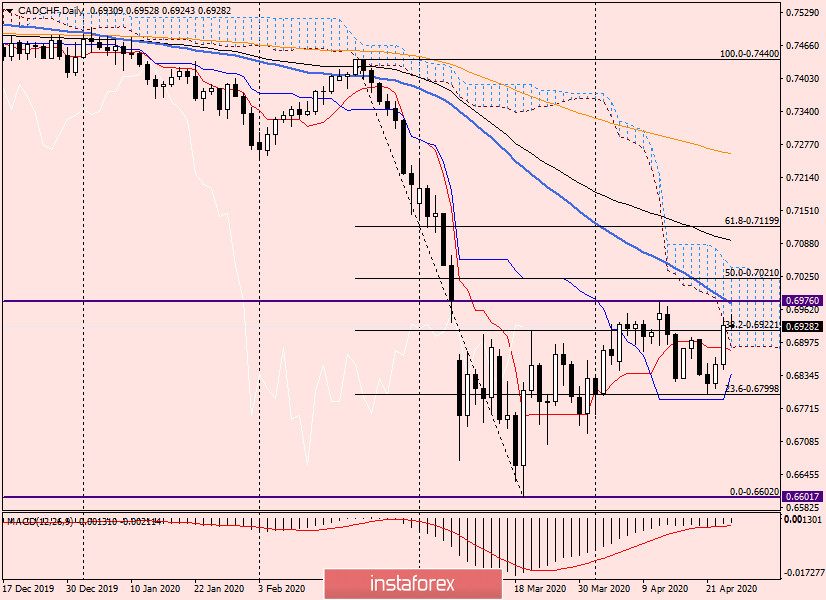
On the daily chart, the picture takes clearer shape. Today, the pair is already trading within the cloud of the Ichimoku indicator, but this is not a signal for further growth. First, you still need to stay within the cloud and not fall out of it down. Second, much more importantly, for further growth, it is necessary to break through the resistance of sellers at 0.6976. And here I would like to draw your attention to the fact that the 50 simple moving average has fallen directly on this level, which is able to provide additional and very strong resistance to attempts to raise the quote.
A break of 50 MA and the resistance of 0.6976, with a close above, signals good prospects to continue the upward trend. A decline that results in the pair coming down from the Ichimoku cloud and closing trading under the Tenkan line will indicate a continuation or resumption of the bearish scenario.
H1
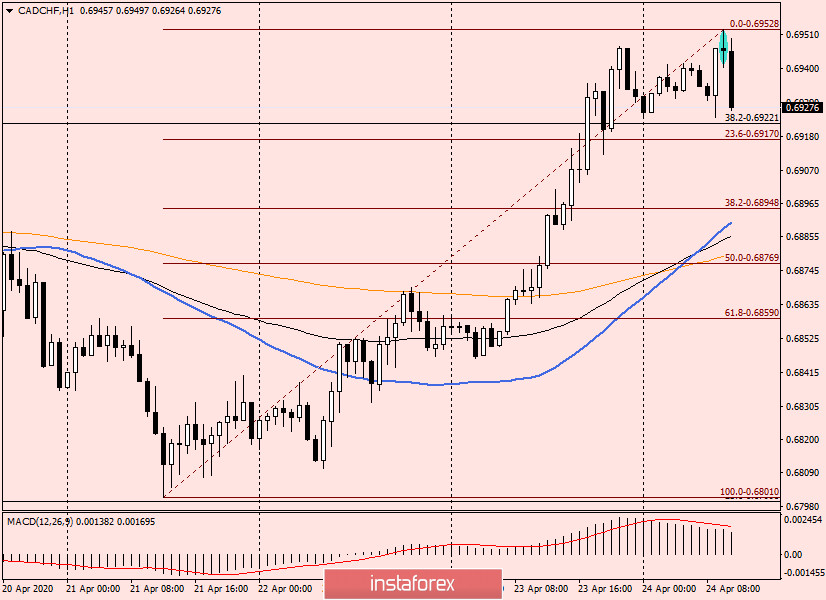
After rising to 0.6953, the pair met strong resistance. The signal for a pullback from this level was the highlighted Doji "Rickshaw" candle. In my personal opinion, there is a high probability of continuing the rise after the rollbacks to 0.6920, 0.6900, and 0.6885, where there are 50 MA and 89 EMA.
Given the technical picture on the weekly and daily charts, I recommend trying to buy the CAD/CHF pair's rate after the pullbacks to the selected prices.
I wish you success and a good weekend!