 English
  Русский
 Bahasa Indonesia
 Bahasa Malay
 ไทย
ไทย Español
 Deutsch
 Български
 Français
 Tiếng Việt
 中文
中文 বাংলা
বাংলা हिन्दी
 Čeština
 Українська
 Română

The pair did not manage to break through the support line 1.2344 (presented in a red bold line), thus it went up, almost testing the level of 1.2399 -a 38.2% pullback level (presented in a red dashed line). Today, the upward movement may continue. Nothing is expected for the economic calendar news.
Trend analysis (Fig. 1).
Today, the upward movement may continue from the level of 1.2369 (closing of the Friday afternoon candle) with the first target of 1.2447 - a 50.0% pullback level (presented in a red dashed line). If this level is broken up, the price may continue to move upward with the target of 1.2494 - a 61.8% retracement level (presented in a red dashed line). A rollback is possible from this level.
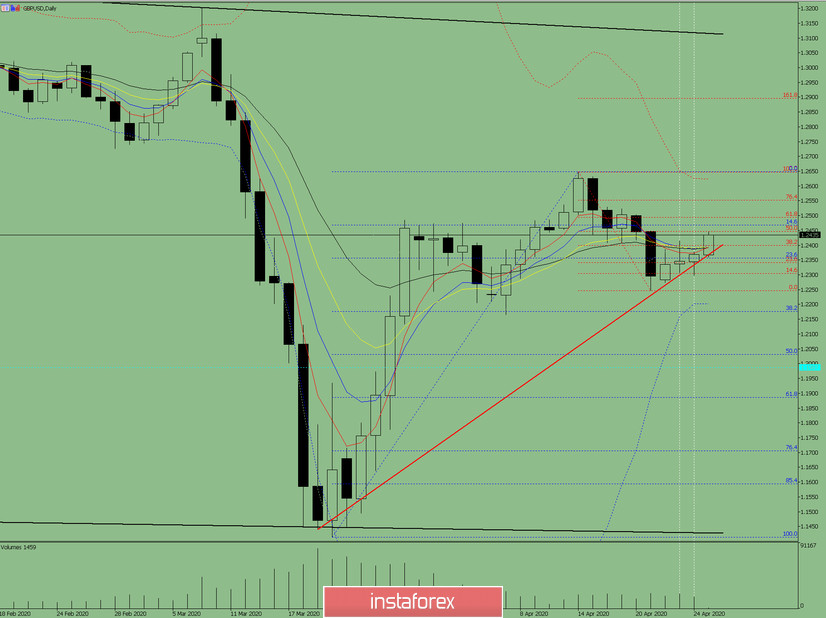
Fig. 1 (daily chart).
Comprehensive analysis:
- Indicator analysis - up;
- Fibonacci levels - up;
- Volumes - up;
- Candlestick analysis - down;
- Trend analysis - up;
- Bollinger Lines - up;
- Weekly schedule - up.
General conclusion:
Today, the price may continue to move upward with the target of 1.2494 - a 61.8% retracement level (presented in a red dashed line).
Another possible scenario is a bearish trend from the level of 1.2447 - a 50.0% pullback level (presented in a red dashed line) with a target of 1.2176 - a 38.2% pullback level (presented ina blue dashed line). If this level is broken down, the price may continue to move downward with the target at the lower fractal 1.2299 (presented in a red dashed line).