 English
  Русский
 Bahasa Indonesia
 Bahasa Malay
 ไทย
ไทย Español
 Deutsch
 Български
 Français
 Tiếng Việt
 中文
中文 বাংলা
বাংলা हिन्दी
 Čeština
 Українська
 Română

Trend analysis (Fig. 1).
Today, an upward pullback is possible from the level of 1.2443 (closing of yesterday's candle) with the target at 1.2496 - a 61.8% pullback level (presented in a red dotted line). In case of breaking this level upwards, the next target will be at 1.2555 - a 75.4% retracement level (presented in a red dashed line).
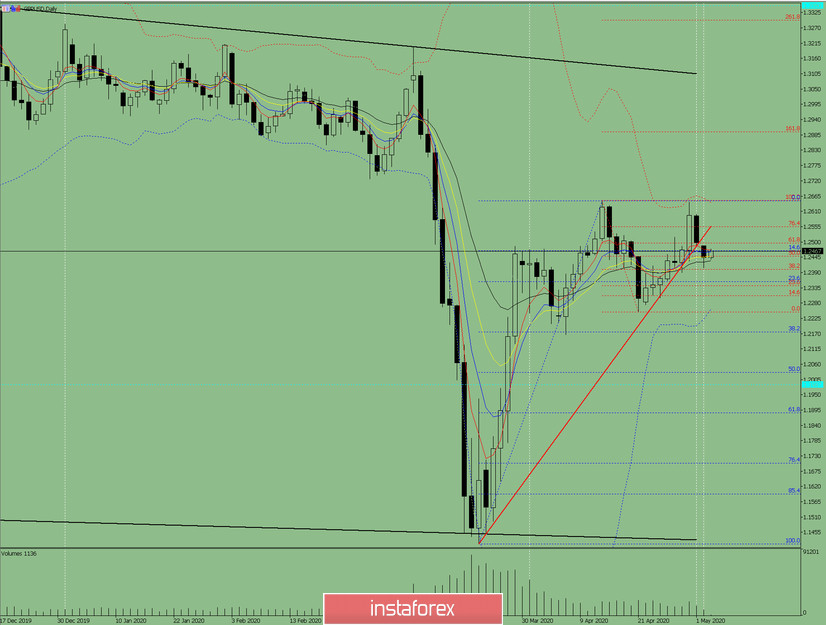
Fig. 1 (daily chart).
Comprehensive analysis:
- Indicator analysis - down;
- Fibonacci levels - up;
- Volumes - up;
- Candlestick analysis - down;
- Trend analysis - up;
- Bollinger Lines - up;
- Weekly schedule - up.
General conclusion:
Today, the price may move upwards with the target of 1.2496 - a 61.8% retracement level (presented in a red dotted line). In case of breaking this level upwards, the next target will be at 1.2555 - a 75.4% retracement level (presented in a red dashed line).
Another possible but unlikely scenario is a bullish trend from the level of 1.2496 - a 61.8% retracement level (presented in a red dashed line) with a target at 1.2357 - a 23.6% retracement level (presented in a blue dashed line). If this level is broken downwards, the price may continue to move downwards with the target of 1.2176 - a 38.2% retracement level (presented in a blue dashed line).