 English
  Русский
 Bahasa Indonesia
 Bahasa Malay
 ไทย
ไทย Español
 Deutsch
 Български
 Français
 Tiếng Việt
 中文
中文 বাংলা
বাংলা हिन्दी
 Čeština
 Українська
 Română

For Gold, the price forms a small potential for the top of May 1. We expect the development of the upward cycle after the breakdown of the level of 1717.46. The level of 1690.06 is the key support. For oil, we continue to expect the development of an upward trend after the breakdown of the level of 26.32. The level of 22.34 is the key support. For Silver, the price formalized the initial conditions for the downward cycle of April 30. The level of 14.66 is the key resistance, while the level of 15.27 is the key support. For oil, the development of the upward cycle from April 27 may continue after the breakdown of the level of 2.192. The level of 2.008 is the key support.
Forecast for May 6:
Analytical review in H1 scale:
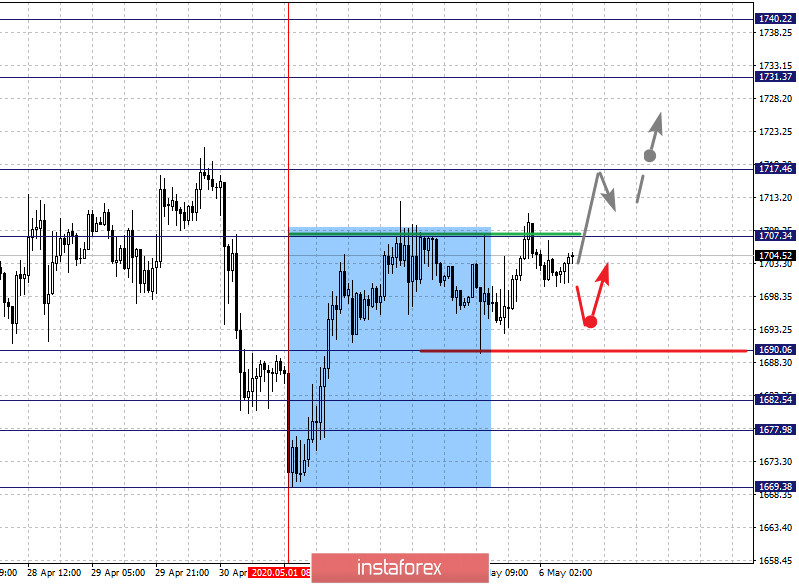
For Gold, the main key levels on the H1 scale are: 1740.22, 1731.37, 1717.46, 1707.34, 1690.06, 1682.54, 1677.98 and 1669.38. Here, the price registered a small potential for the upward movement of May 1. We expect short-term upward movement in the range of 1707.34 - 1717.46. The breakdown of the last level will lead to a pronounced movement. Here, the target is 1731.37. We consider the level of 1740.22 to be a potential value for the top. Upon reaching which, we expect consolidation, as well as a downward pullback.
A short-term downward movement in the range of 1690.06 - 1682.54 is expected. The range of 1682.54 - 1677.98 is the key support for the top and its passage at the price will lead to the development of a downward structure. In this case, the target is 1669.38.
The main trend is building potential for the top of May 1
Trading recommendations:
Buy: 1708.00 Take profit: 1717.00
Buy: 1718.00 Take profit: 1730.00
Sell: 1690.00 Take profit: 1683.00
Sell: 1677.00 Take profit: 1670.00
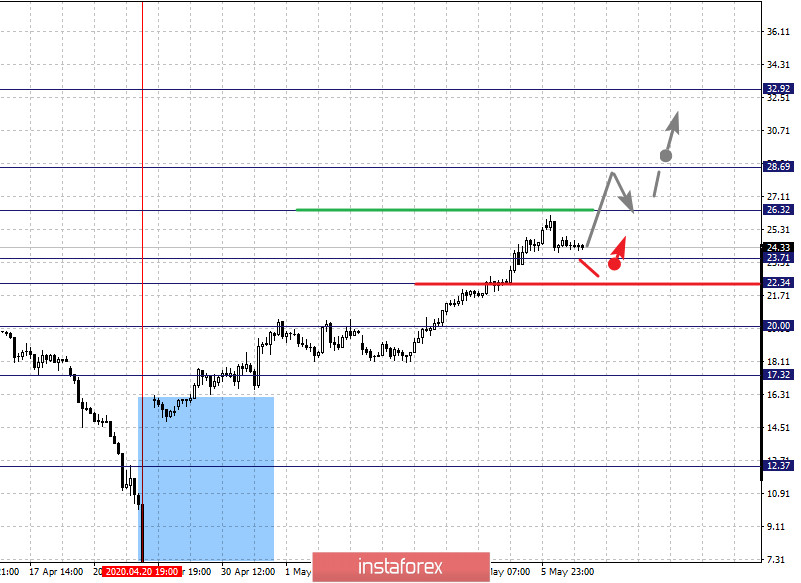
For Oil, the main key levels on the H1 scale are: 32.92, 28.69, 26.32, 23.71, 22.34, 20.00 and 17.32. Here, we are following the development of the ascending structure of April 20. We expect further upward movement after the breakdown of the level of 26.32. In this case, the target is 28.69. Price consolidation is near this level. As a potential value for the ascending structure, we consider the level of 32.92. Upon reaching which, we expect a downward pullback.
A short-term downward movement is possible in the range of 23.71 - 22.34. The breakdown of the last level will lead to an in-depth correction. Here, the target is 20.00. This level is a key support for the top and its passage at the price will lead to the formation of initial conditions for the downward cycle. In this case, the potential goal is 17.32.
The main trend is the upward structure of April 20
Trading recommendations:
Buy: 26.32 Take profit: 28.60
Buy: 28.80 Take profit: 31.85
Sell: 23.71 Take profit: 22.40
Sell: 22.28 Take profit: 20.50
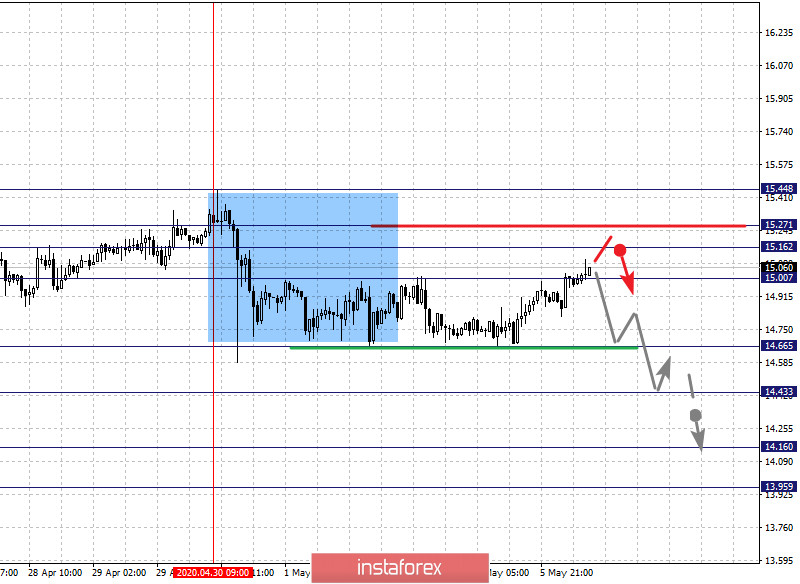
For Silver, the main key levels on the H1 scale are: 15.27, 15.16, 15.00, 14.66, 14.43, 14.16 and 13.95. Here, the price forms a downward potential from April 30. At the moment, the price is in the correction zone. We expect the downward movement to continue after a breakdown of 14.66. In this case, the target is 14.43. Price consolidation is near this level. The breakdown of the level of 14.43 should be accompanied by a pronounced downward movement. Here, the goal is 14.16. We consider the level of 13.95 to be a potential value for the bottom. Upon reaching which, we expect consolidation, as well as an upward pullback.
A short-term upward movement, as well as consolidation are possible in the range of 15.00 - 15.16. The range of 15.16 - 15.27 is a key support for the descending structure of April 30 and the price passing this range will lead to the formation of initial conditions for the top. In this case, the potential target is 15.44.
The main trend is the formation of the downward potential of April 30
Trading recommendations:
Buy: 15.00 Take profit: 15.16
Buy: 15.27 Take profit: 15.44
Sell: 14.66 Take profit: 14.44
Sell: 14.42 Take profit: 14.16
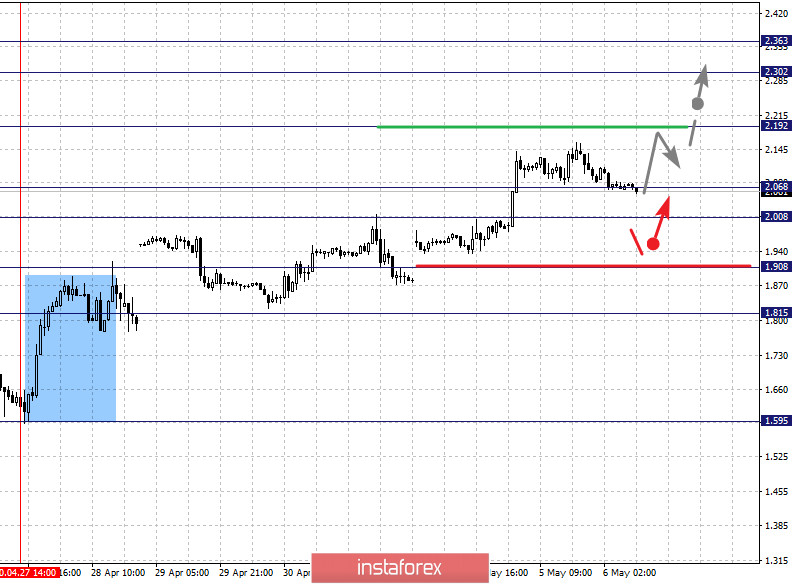
For Natural Gas, the main key levels on the H1 scale are: 2.363, 2.302, 2.192, 2.068, 2.008, 1.908, and 1.815. Here, we are following the development of the ascending structure of April 27. We expect further upward movement after the breakdown of 2.192. In this case the target is 2.300. For the potential value for the top, we consider the level of 2.363. The movement to which is expected after the breakdown of the level of 2.302.
A short-term downward movement is possible in the range of 2.068 - 2.008. The breakdown of the last level will lead to an in-depth correction. Here, the potential target is 1.908. This level is a key support for the upward structure its breakdown will lead to the formation of initial conditions for the downward cycle.
The main trend is the upward structure of April 27
Trading recommendations:
Buy: 2.194 Take profit: 2.300
Buy: 2.305 Take profit: 2.360
Sell: 2.068 Take profit: 2.010
Sell: 2.000 Take profit: 1.910