 English
  Русский
 Bahasa Indonesia
 Bahasa Malay
 ไทย
ไทย Español
 Deutsch
 Български
 Français
 Tiếng Việt
 中文
中文 বাংলা
বাংলা हिन्दी
 Čeština
 Українська
 Română

Procter & Gamble stock price remains in a bullish trend making higher highs and higher lows. Price is now trading at its all time highs with no sign of a reversal. However there are some warning signs that we need to keep a close eye on.
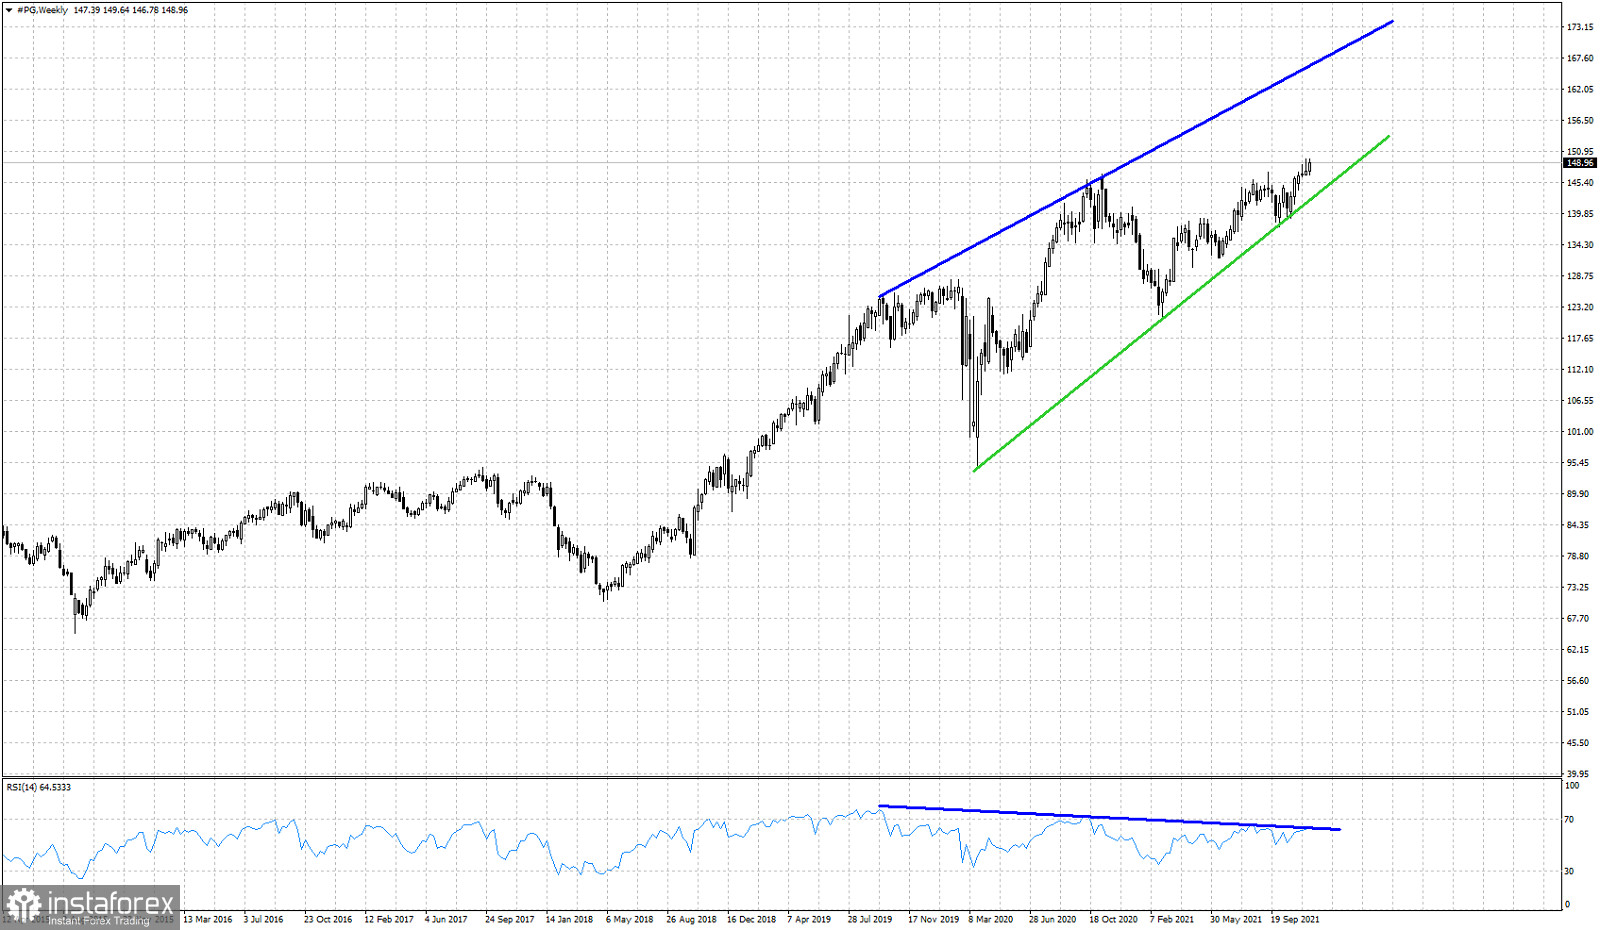
Green line- support trend line
As can be seen in the weekly chart above, price is still respecting the green upward sloping trend line which is the main support. Support now is at $142. As long as price is above this level, short-term trend at least will remain bullish. Breaking below it we will get our first bearish reversal signal. The blue lines in the weekly chart above show us the warning we were talking about. The RSI is not making higher highs as price does. This means that the bullish trend is weakening. The time for a reversal approaches, so traders need to be very cautious. The RSI bearish divergence is just a warning and not a reversal signal. Bulls better protect their gains. Aggressive traders will look to bet in favor of a reversal specially if price breaks below the green trend line.