 English
  Русский
 Bahasa Indonesia
 Bahasa Malay
 ไทย
ไทย Español
 Deutsch
 Български
 Français
 Tiếng Việt
 中文
中文 বাংলা
বাংলা हिन्दी
 Čeština
 Українська
 Română
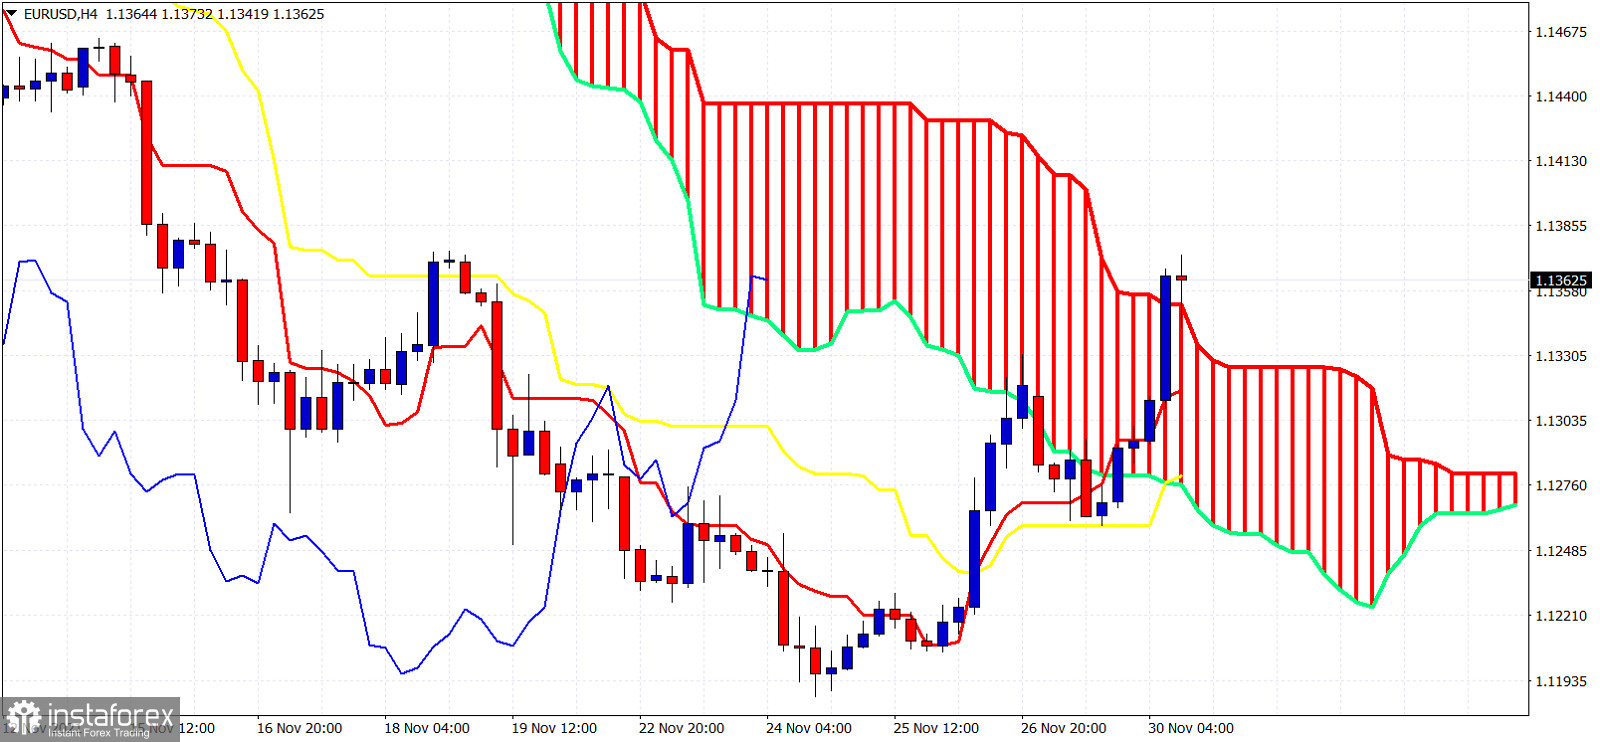
EURUSD is breaking above important short-term cloud resistance levels providing the first short-term reversal signal after October. Price is starting to form higher highs and higher lows as expected after our technical analysis bullish signal.
 Relevance until
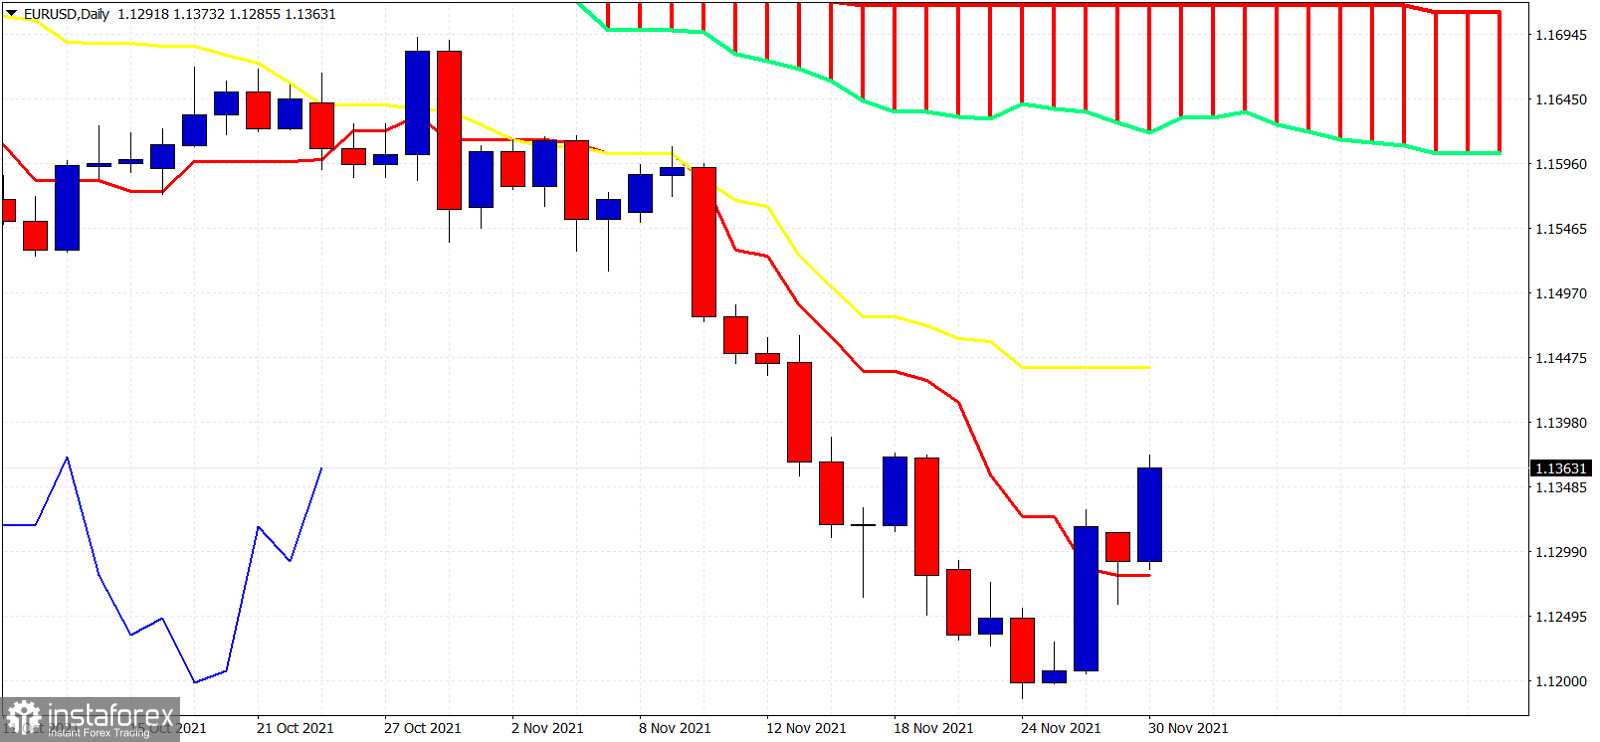
EURUSD is breaking above important short-term cloud resistance levels providing the first short-term reversal signal after October. Price is starting to form higher highs and higher lows as expected after our technical analysis bullish signal.