 English
  Русский
 Bahasa Indonesia
 Bahasa Malay
 ไทย
ไทย Español
 Deutsch
 Български
 Français
 Tiếng Việt
 中文
中文 বাংলা
বাংলা हिन्दी
 Čeština
 Українська
 Română

The pair traded upwards on Monday and tested 1.0924 - a 61.8% pullback level (presented in a blue dotted line). Today, the price may continue to move up. Economic calendar news for the euro is expected at 09:00 UTC, and for the dollar at 12:30 and 14:00 UTC.
Trend analysis (Fig. 1).
Today, the upward trend is likely to continue from the level of 1.0917 (closing of yesterday's candle) with the target at 1.0960 - a 76.4% retracement level (presented in a blue dashed line). From this level, the price may begin to move downwards with the target of 1.0888 - a 38.2% pullback level (presented in a red dashed line).
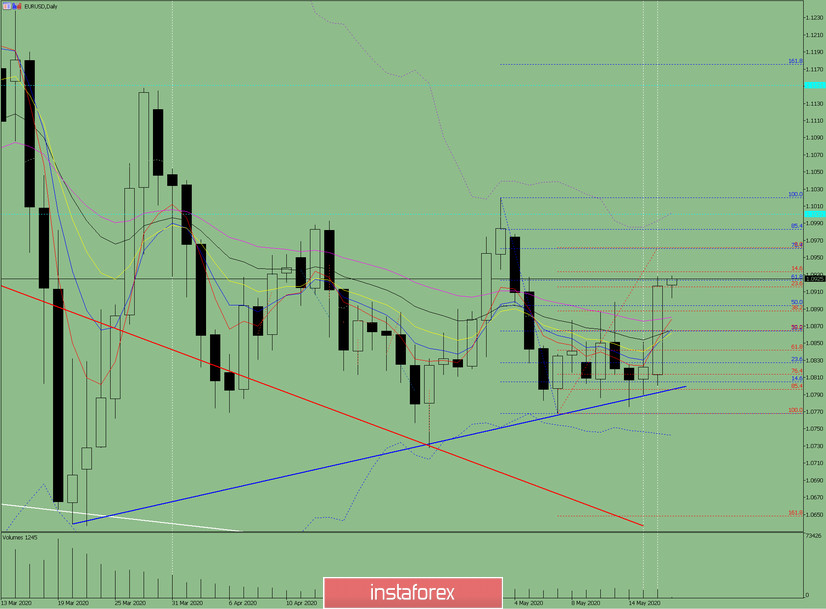
Fig. 1 (daily chart).
Comprehensive analysis:
- Indicator analysis - up;
- Fibonacci levels - up;
- Volumes - down;
- Candlestick analysis - up;
- Trend analysis - up;
- Bollinger Lines - up;
- Weekly schedule - up.
General conclusion:
Today, the price may continue to move upwards from the level of 1.0917 (closing of yesterday's candle) with the target of 1.0960 - a 76.4% retracement level (presented in a blue dashed line). From this level, the price may begin to move downward with the target of 1.0888 - a 38.2% pullback level (represented in a red dashed line).
Another possible scenario is an upward trend from 1.0960 - a 76.4% retracement level (presented in a blue dashed line) with a target of 1.0983 - an 85.4% retracement level (presented in a blue dashed line).