 English
  Русский
 Bahasa Indonesia
 Bahasa Malay
 ไทย
ไทย Español
 Deutsch
 Български
 Français
 Tiếng Việt
 中文
中文 বাংলা
বাংলা हिन्दी
 Čeština
 Українська
 Română

Trend analysis (Fig. 1).
On Tuesday, the price is likely to move in the upward trend from the level of 1.0899 (the closing of yesterday's candlestick) with the target at 1.0941, which is a pullback level of 50.0% (the blue dashed line). Most likely, the price will continue to grow from this level with the target at 1.0957, a retracement level of 61.8% (the blue dashed line).
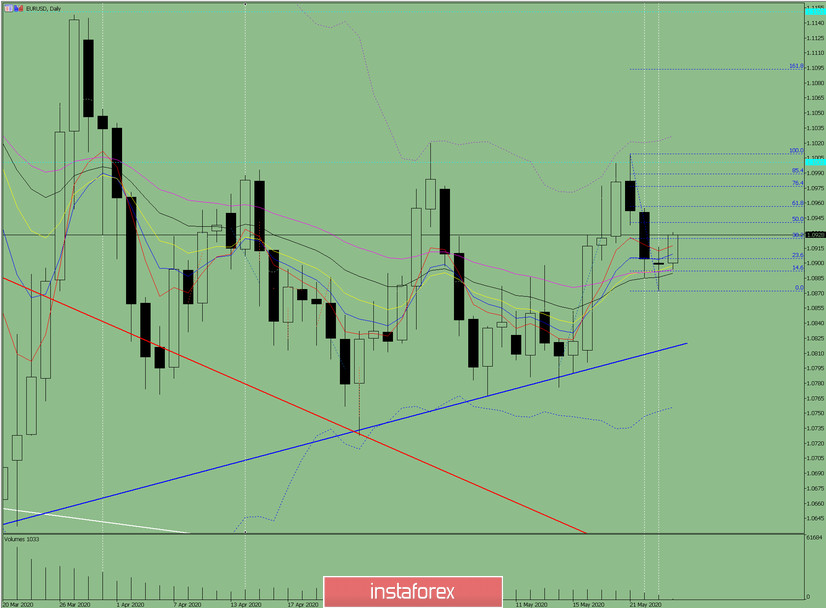
Fig. 1 (daily chart).
Comprehensive analysis:
- indicator analysis - up;
- Fibonacci retracement levels - up;
- volumes - up;
- candlestick analysis - up;
- trend analysis - up;
- Bollinger Lines - up;
- weekly chart - up.
General conclusion:
Today, the price is expected to rise from the level of 1.0899 (the closing of yesterday's candlestick) with the target at 1.0957, a retracement level of 61.8% (the blue dotted line). Most likely, the price will start falling from this level. A pullback may occur.
Unlikely scenario: the price may move down from a pullback level of 50.0% - 1.0941 (the blue dashed line), with the target at 1.0872, a lower fractal (the blue dashed line).