 English
  Русский
 Bahasa Indonesia
 Bahasa Malay
 ไทย
ไทย Español
 Deutsch
 Български
 Français
 Tiếng Việt
 中文
中文 বাংলা
বাংলা हिन्दी
 Čeština
 Українська
 Română

On Wednesday, the euro/dollar pair was moving downwards and testes the 61.8% retracement level at 1.0935 (a red dotted line). Then, the price rose. The market hit the upper fractal located at 1.1009 (a white dotted line). On Thursday, market participants expect important macroeconomic data.
Trend analysis (picture 1)
On Thursday, the market may continue moving up from the level of 1.1007 (a close of yesterday's daily candle) to the target of 1.1067 that is a 50.0% retracement (a blue dotted line). It is quite possible that the price may start falling from the mentioned level. The target may be the 38.2% retracement located at 1.0973 (a red dotted line).
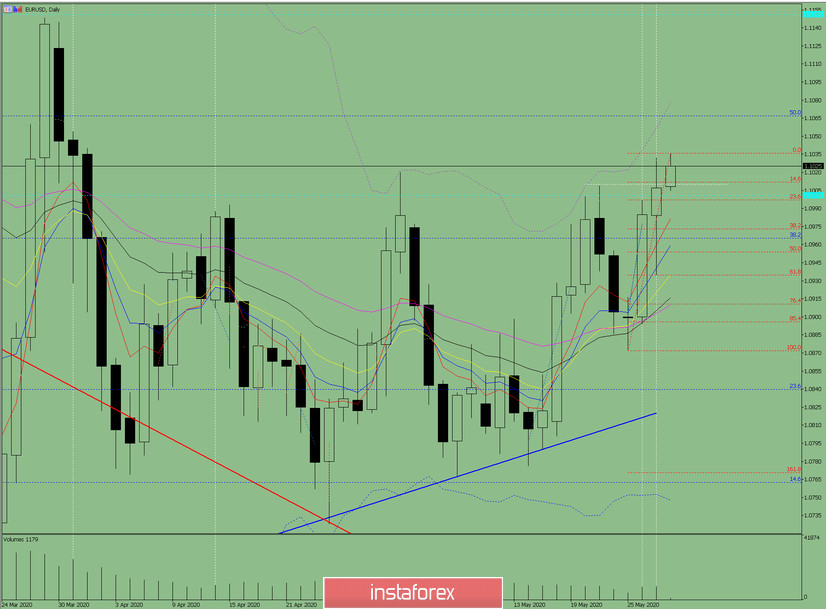
Picture 1 (Daily chart).
Comprehensive analysis:
- indicator analysis - up;
- Fibonacci levels - up;
- volumes - up;
- candle analysis - up;
- trend analysis - up;
- Bollinger bands - up;
- weekly chart - up.
Conclusion:
Today, the price may go on rising from the level of 1.1007 (a close of yesterday's daily candle) with the target at 1.1067 that is a 50.0% retracement (a blue dotted line). There is a possibility that the price may start dropping from the mentioned level.
According to another scenario, the price may start falling after hitting the upper fractal situated at 1.1036 (a red dotted line). The target is the 38.2% retracement located at 1.0937 (a red dotted line).