 English
  Русский
 Bahasa Indonesia
 Bahasa Malay
 ไทย
ไทย Español
 Deutsch
 Български
 Français
 Tiếng Việt
 中文
中文 বাংলা
বাংলা हिन्दी
 Čeština
 Українська
 Română

The pair traded upward on Tuesday and broke through the historical resistance level of 1.1912 (blue dotted line). Today the price may continue to move up. Economic calendar news for the euro is expected at 09:00 and 10:00 UTC, and for the dollar at 14:30 and 18:00 UTC. The OPEC meeting is scheduled today at 14:00 UTC.
Trend analysis (Fig. 1).
The market may continue to move upward from the level of 1.1933 (closing of yesterday's daily candle) with the target at 1.2020 located at the upper border of the Bollinger line indicator (purple dotted line). In case of reaching this level, the upward trend may continue with the next target of 1.2103 - a 76.4% pullback level (blue dashed line).
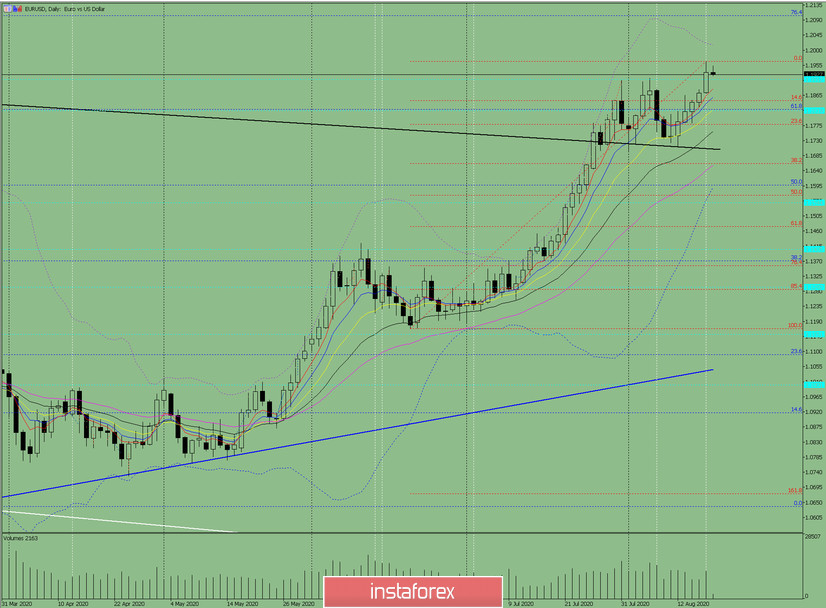
Figure: 1 (daily chart).
Comprehensive analysis:
- Indicator analysis - up;
- Fibonacci levels - up;
- Volumes - up;
- Candlestick analysis - down;
- Trend analysis - up;
- Bollinger lines - up;
- Weekly chart - up.
General conclusion:
Today the price may continue to move upward with the target of 1.2020 located at the upper border of the Bollinger Band indicator (purple dotted line). If this level is reached, the upward trend may continue with the next target of 1.2103 - a 76.4% pullback level (blue dashed line).
Another possible scenario is upon reaching the upper fractal 1.1967 (red dotted line), the price may move down to 1.1850 - a 14.6% pullback level (red dotted line).