 English
  Русский
 Bahasa Indonesia
 Bahasa Malay
 ไทย
ไทย Español
 Deutsch
 Български
 Français
 Tiếng Việt
 中文
中文 বাংলা
বাংলা हिन्दी
 Čeština
 Українська
 Română

We have been following the Dollar index analogy with respect to 2017 and so far price is following that previous pattern. We have explained many times before the similarities of the 2017 decline from 97 to 9385 and using it we predicted our recent pull back.
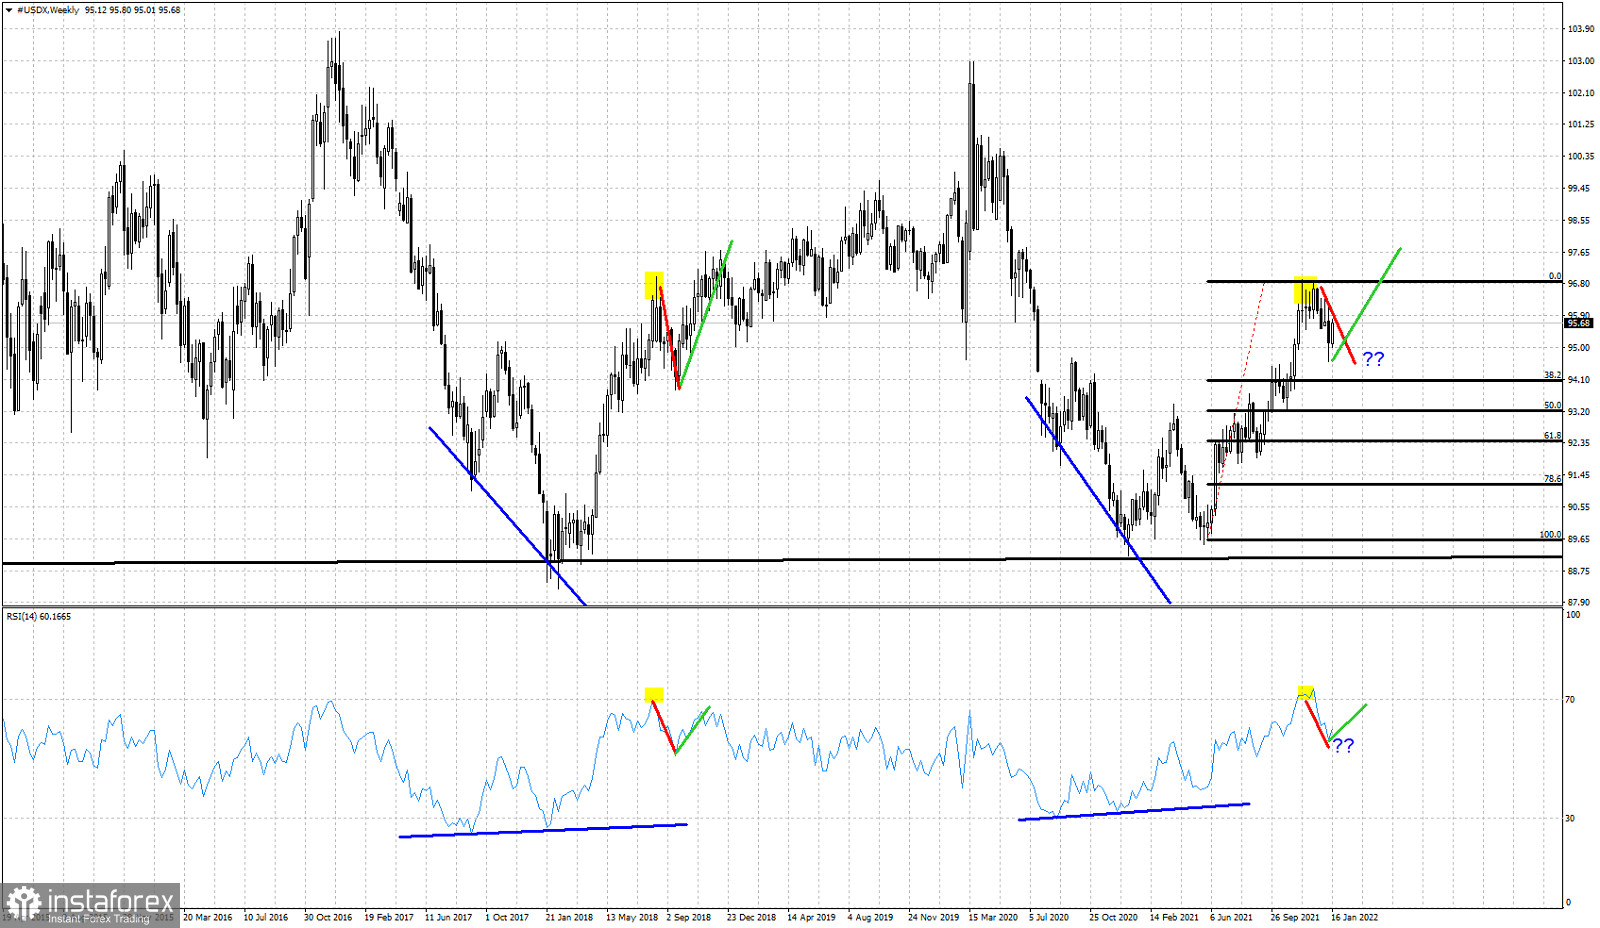
Red line- correction duplicated
Yellow rectangle- short-term top duplicated
Green line- will we see another duplicate movement?
The Dollar index is bouncing higher. The corrective pull back could very well be over and price might be starting its next leg higher that will push the index to form higher highs. This is what happened back in 2017. Will we see a repeat? So far price is following history. There is still room for a deeper pull back towards the 38% Fibonacci retracement around 94.10 but it is not necessary. If however price breaks below the 94.10, then the chances of following the 2017 pattern will diminish dramatically.