 English
  Русский
 Bahasa Indonesia
 Bahasa Malay
 ไทย
ไทย Español
 Deutsch
 Български
 Français
 Tiếng Việt
 中文
中文 বাংলা
বাংলা हिन्दी
 Čeština
 Українська
 Română

NZDUSD as expected by our analysis had produced a strong bounce from the 0.67 price level. We warned bears back then that the bullish divergence signals were implying an imminent reversal. Combined with the break above the blue downward sloping trend line, we expected a bounce at least towards the 38% Fibonacci retracement.
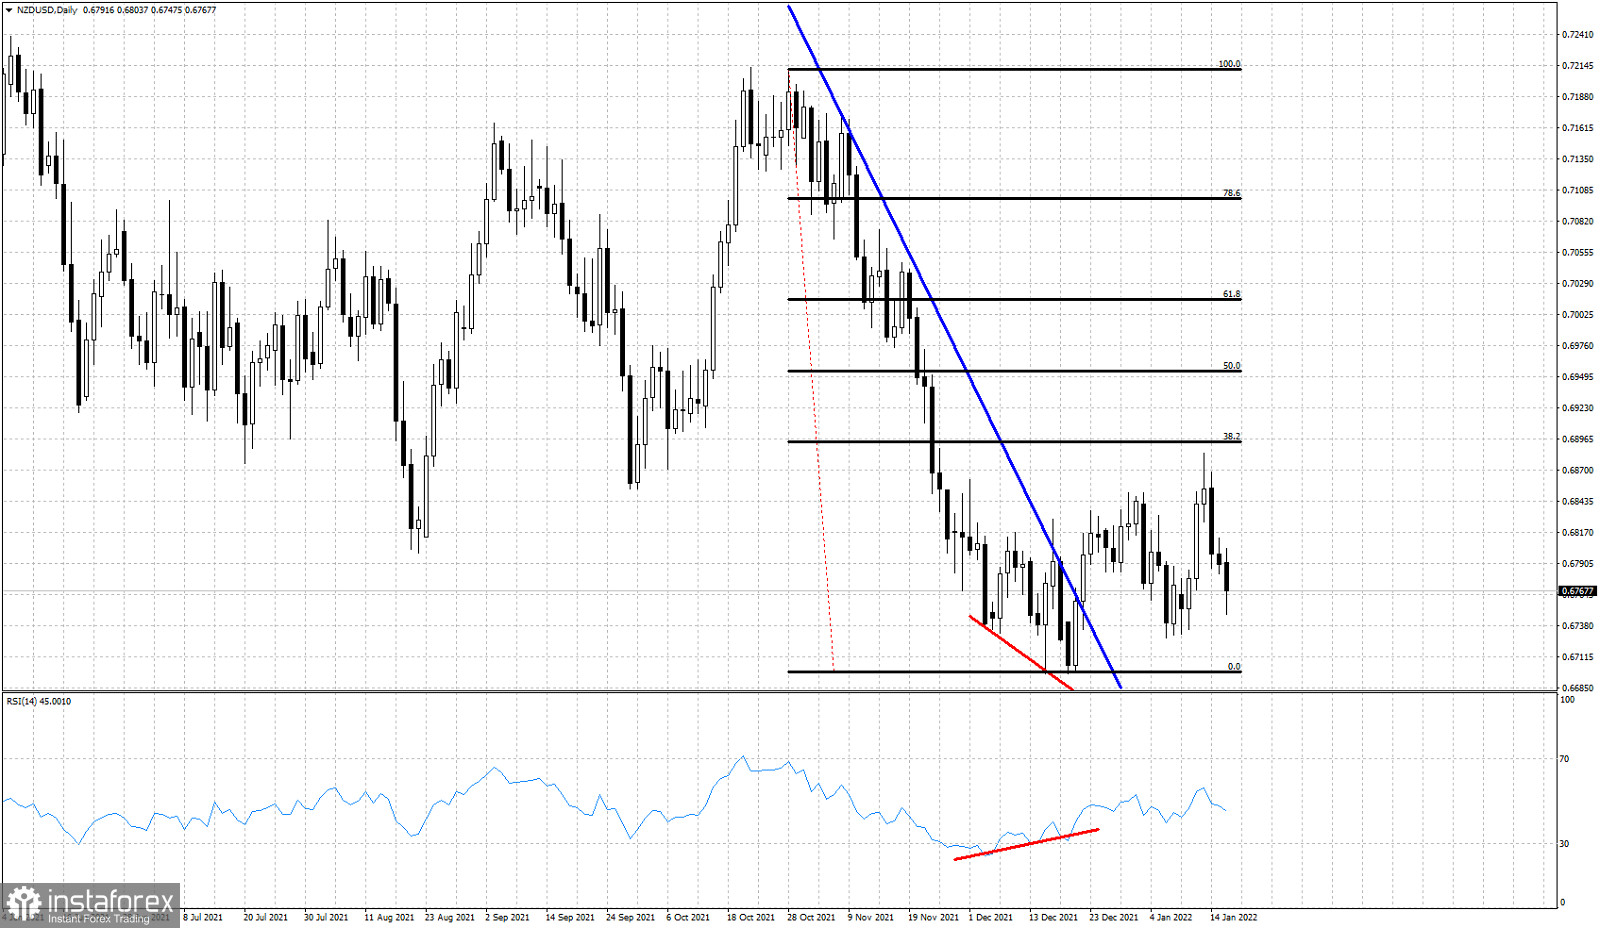
Blue line - resistance trend line
Black lines- Fibonacci retracement
NZDUSD after bottoming at 0.67 is making higher highs and higher lows. Price has reached our first bounce target very close to 0.6895. However the higher high that followed on January 13th was not strong enough as price got rejected. This rejection at the 38% Fibonacci level if followed by a decline below 0.6727, it would provide a strong bearish signal. Until then bulls have some hopes for a move higher.