 English
  Русский
 Bahasa Indonesia
 Bahasa Malay
 ไทย
ไทย Español
 Deutsch
 Български
 Français
 Tiếng Việt
 中文
中文 বাংলা
বাংলা हिन्दी
 Čeština
 Українська
 Română

Gold price is making new higher highs. Gold provided us yesterday with a new bullish signal after breaking above the key short-term resistance of $1,830. $1,830 was tested three-four times before. Gold continued to respect $1,800 and finally broke above resistance. Today we see price continue on this bullish momentum as expected.
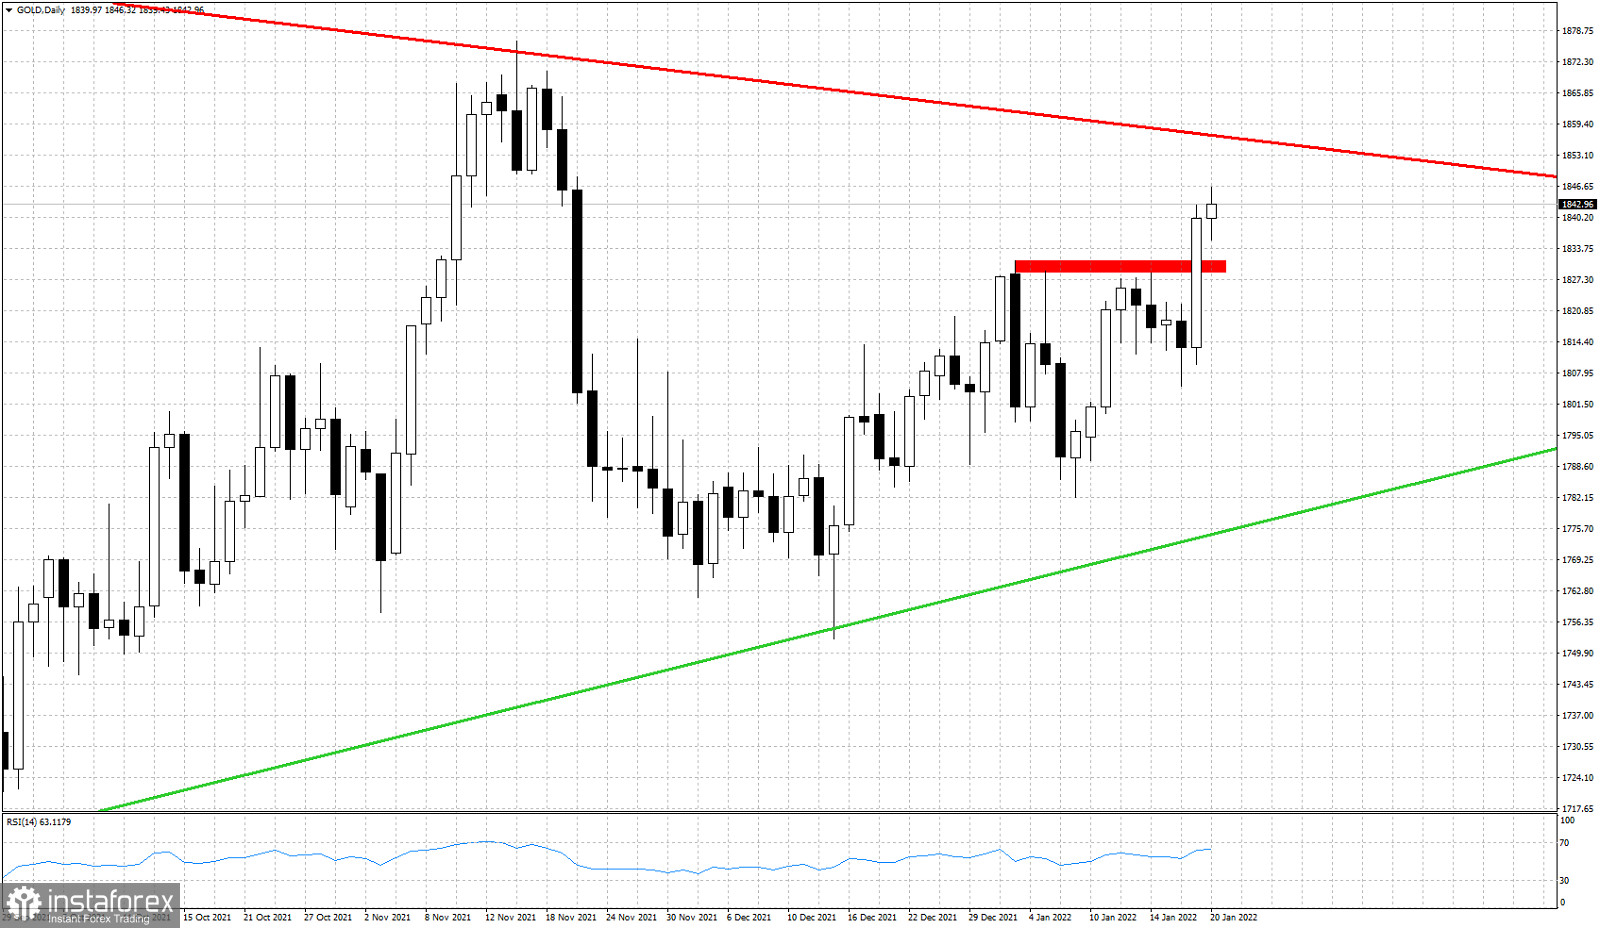
Red line- major resistance trend line
Green line- major support trend line
Gold price has the potential to move towards the red resistance trend line found at $1,856-60 area. Close or on top of this area I expect this upward leg in Gold to be finished. Gold is making higher highs and higher lows since the $1,752 low. The latest important low in our Daily chart is at $1,805. As long as price is above this level, Gold is considered to be in a short-term bullish trend. In the medium-term we see Gold still trapped inside the big triangle pattern shown by the green and red trend line boundaries in the Daily chart above.