 English
  Русский
 Bahasa Indonesia
 Bahasa Malay
 ไทย
ไทย Español
 Deutsch
 Български
 Français
 Tiếng Việt
 中文
中文 বাংলা
বাংলা हिन्दी
 Čeština
 Українська
 Română

The Dollar index is in a bullish weekly trend. Despite price briefly breaking out of the bullish channel, on a weekly basis we have not seen a break down out of the bullish channel. Price continues to follow our analogy to 2017 that we have talked about many times before.
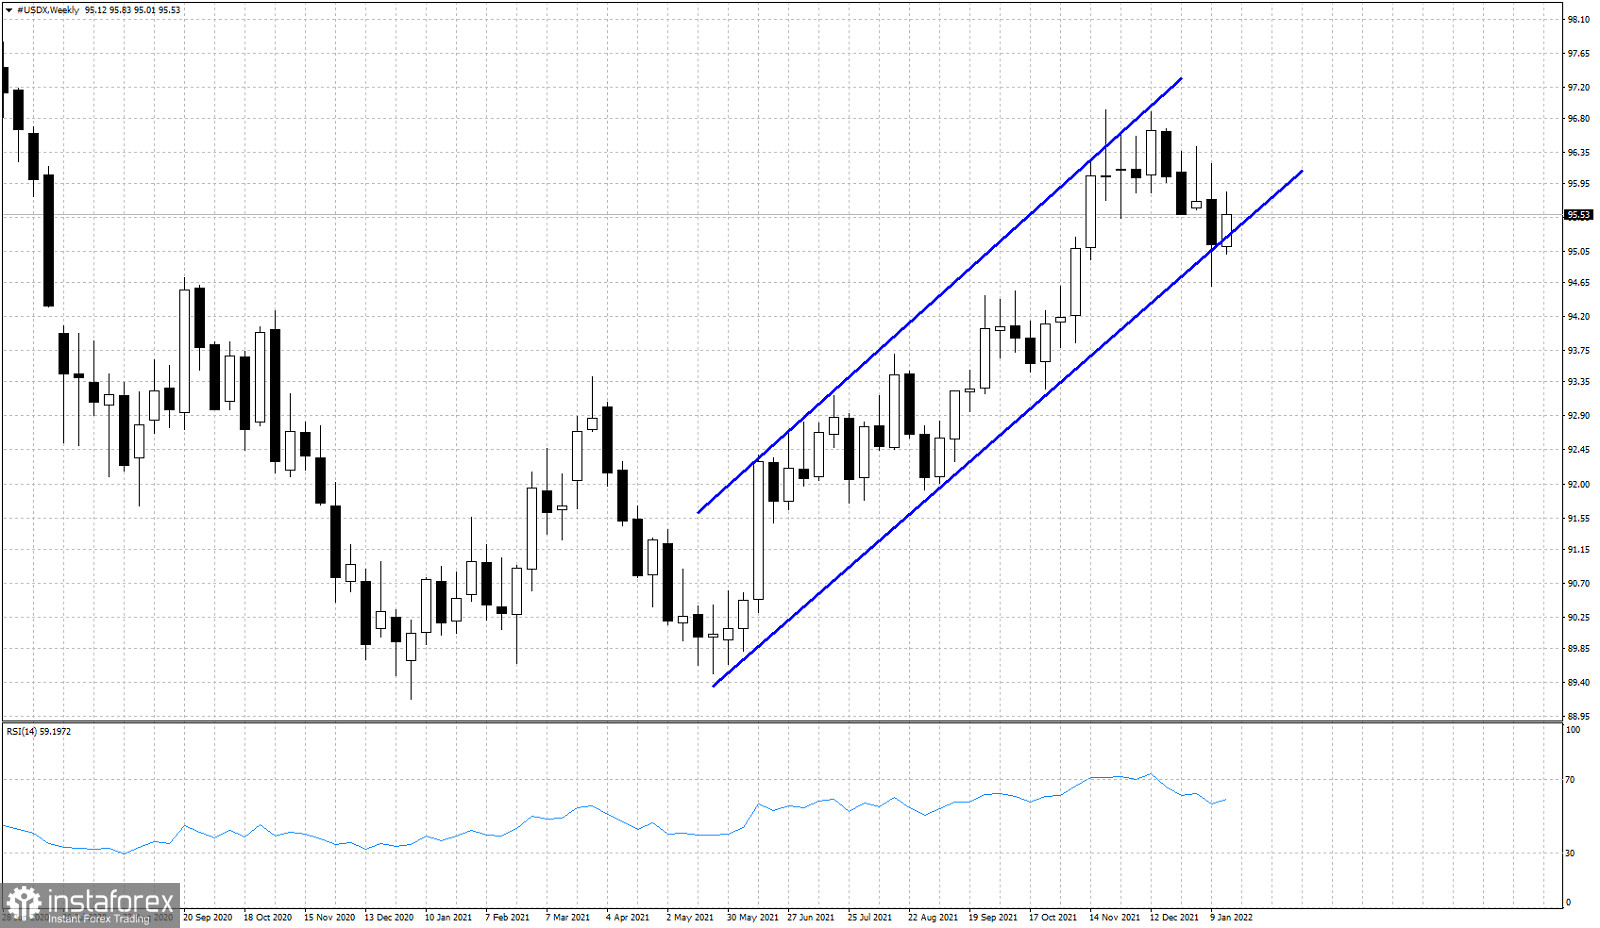
Last week price almost exited the channel. This week price is bouncing off the channel boundary. What next? Bulls do not want to see price break below this week's lows. That would be a sign of weakness.
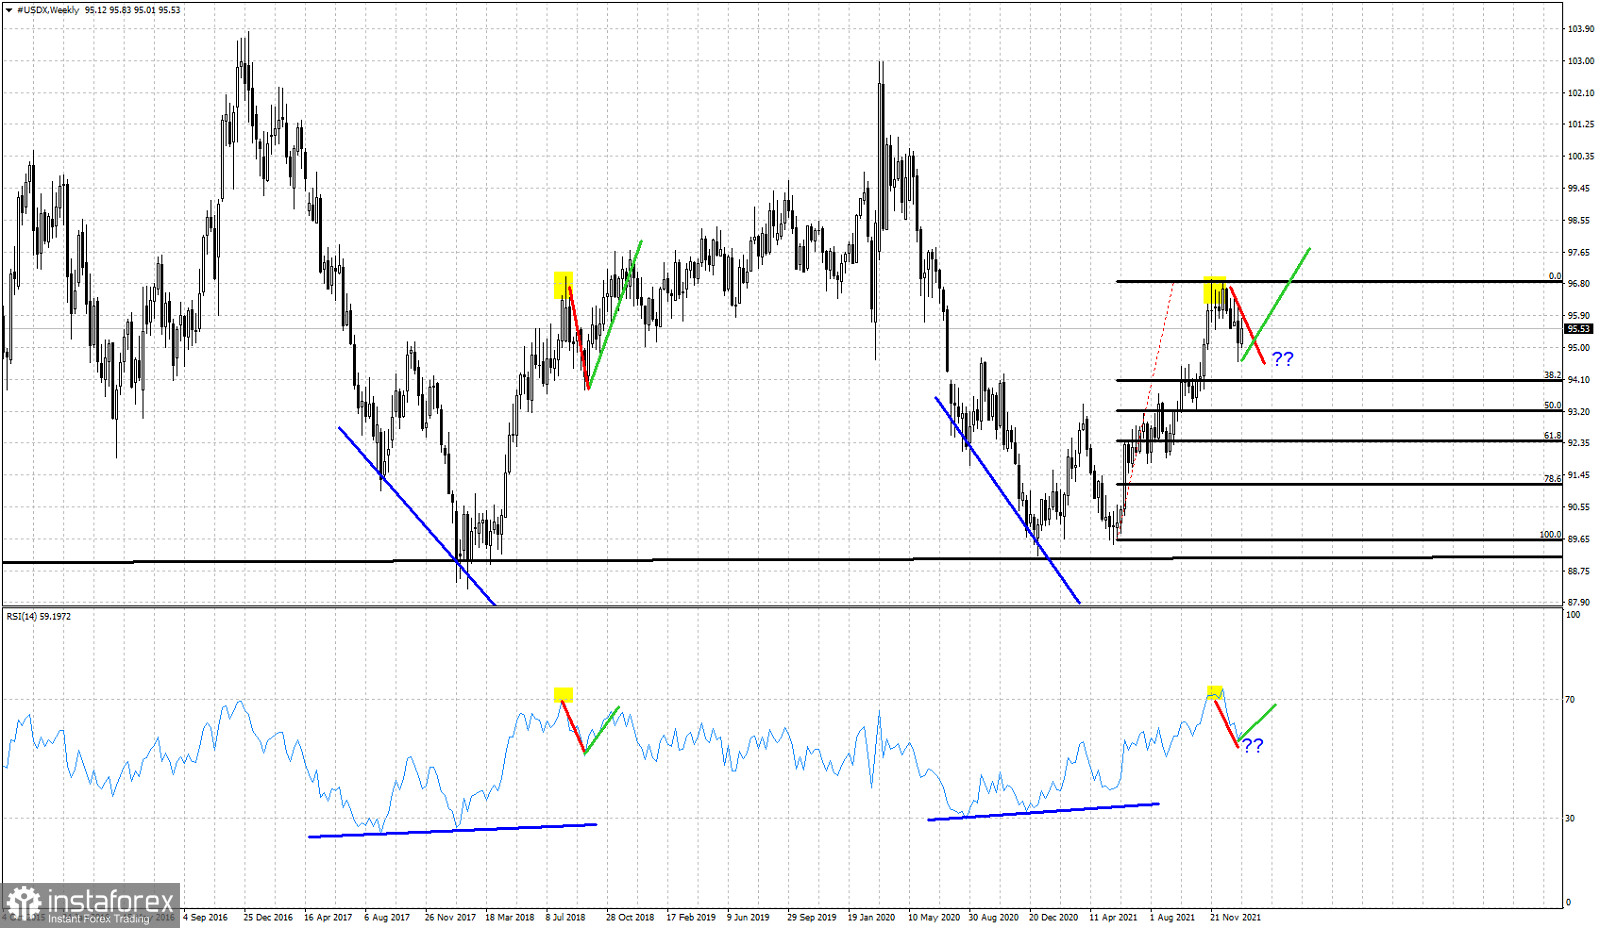
Red line- similar declines
Yellow rectangle- similar RSI tops and short-term reversals
Green lines- expected rise similar to 2018
Will the Dollar index resume its up trend like it did back in 2018 after the red corrective pull back? The Dollar index has so far retraced only a little bit more than the 23.6% of the entire rise from 89.60. The 38% Fibonacci level has not been met. It is not necessary to reach the 38% level in order to say that the pull back is complete, but for now we should keep this scenario open, as there are still chances of a deeper correction towards that Fibonacci level.