 English
  Русский
 Bahasa Indonesia
 Bahasa Malay
 ไทย
ไทย Español
 Deutsch
 Български
 Français
 Tiếng Việt
 中文
中文 বাংলা
বাংলা हिन्दी
 Čeština
 Українська
 Română

Back in December when Ethereum was trading around $4,000 we warned traders that a break below the support area of $3,985 would be a bearish reversal sign. On January 5th another analysis of ours warned bulls using the Ichimoku cloud indicator when price was showing rejection signs.
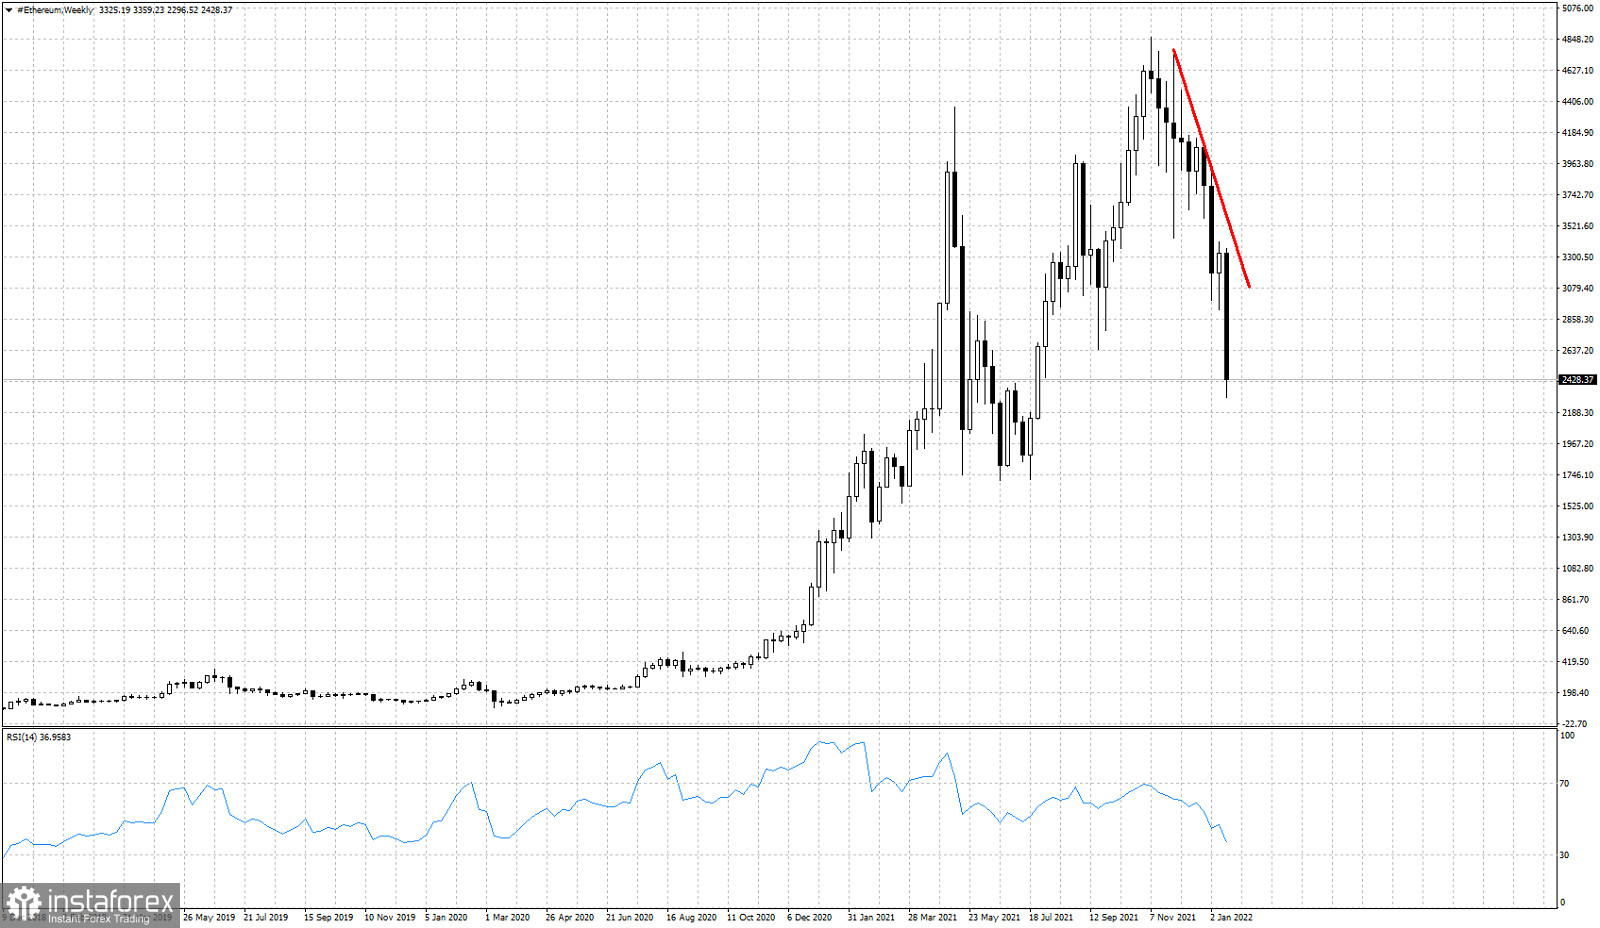
On January 6th our analysis confirmed the trend change and the bearishness in Ethereum's charts as price was testing $3,300. Price is now trading around $2,500 having retraced 78.6% of the entire rise from the June - July 2021 lows. This is the last support bulls have, as a break below it will increase chances of pushing below the $1,700 lows of the summer of 2021. There is no sign of this decline stopping yet. Buying now seems like trying to catch a falling knife. Traders need to be very cautious.