 English
  Русский
 Bahasa Indonesia
 Bahasa Malay
 ไทย
ไทย Español
 Deutsch
 Български
 Français
 Tiếng Việt
 中文
中文 বাংলা
বাংলা हिन्दी
 Čeština
 Українська
 Română

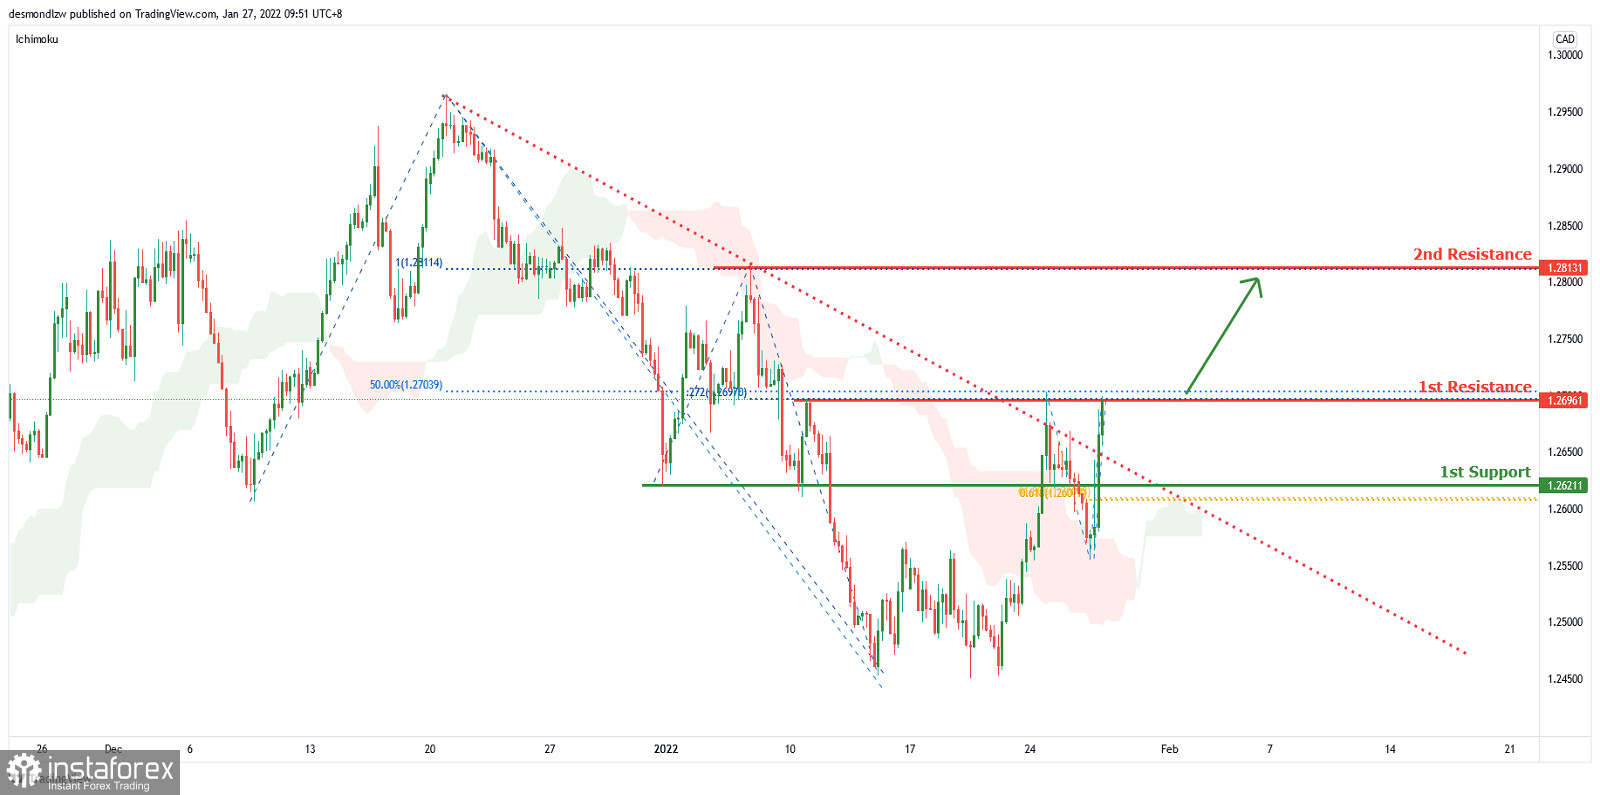
On the H4 chart price has recently broken out of the descending trendline and is above the Ichimoku cloud and near 1st resistance level of 1.26961 which is also 50% Fibonacci retracement and 127.2% Fibonacci projection. Price can potentially go to the 2nd resistance level of 1.28131 which is a graphical overlap resistance. Alternatively price can potentially dip to the 1st support level of 1.26211 which is also 61.8% Fibonacci retracement and 61.8% Fibonacci projection.
Trading Recommendation
Entry:1.26961
Reason for Entry:
Horizontal overlap resistance and 50% Fibonacci retracement, 127.2% Fibonacci projection
Take Profit: 1.27274
Reason for Take Profit:
Horizontal swing high resistance and 100% Fibonacci projection
Stop Loss: 1.26211
Reason for Stop Loss:
Horizontal swing low support and 61.8% Fibonacci projection, 61.8% Fibonacci projection