 English
  Русский
 Bahasa Indonesia
 Bahasa Malay
 ไทย
ไทย Español
 Deutsch
 Български
 Français
 Tiếng Việt
 中文
中文 বাংলা
বাংলা हिन्दी
 Čeština
 Українська
 Română

GBP/USD rose above 1.3550 on Tuesday but lost its traction in the early trading hours of the NA session. The greenback holds its ground against its rivals after the data from the US showed that the trade deficit widened to $101,4 billion in December.
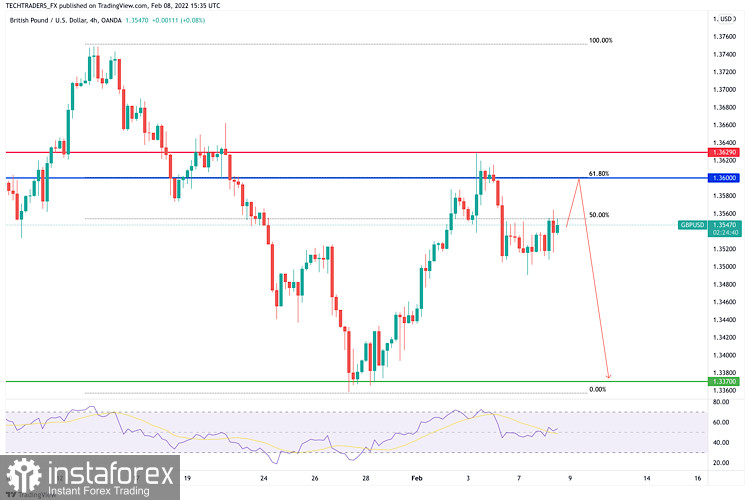
GBP/USD is moving up and down near the 100-period and 200-period SMAs on the four-hour chart. Additionally, the lack of directional strength is mirrored by the Relative Strength Index (RSI) indicator on the same chart, which continues to move sideways near 50.
On the downside, 1.3520 (Fibonacci 38.2% retracement level of the latest uptrend) aligns as interim support before 1.3500 (psychological level, 50-period SMA, Fibonacci 50% retracement). In case a four-hour candle closes below the latter, the pair could stretch lower toward 1.3460 (Fibonacci 61.8% retracement).
In order to regain its bullish momentum and target 1.3600 (psychological level), the pair needs to rise above 1.3560 (Fibonacci 23.6% retracement) and starts using that level as support.