 English
  Русский
 Bahasa Indonesia
 Bahasa Malay
 ไทย
ไทย Español
 Deutsch
 Български
 Français
 Tiếng Việt
 中文
中文 বাংলা
বাংলা हिन्दी
 Čeština
 Українська
 Română
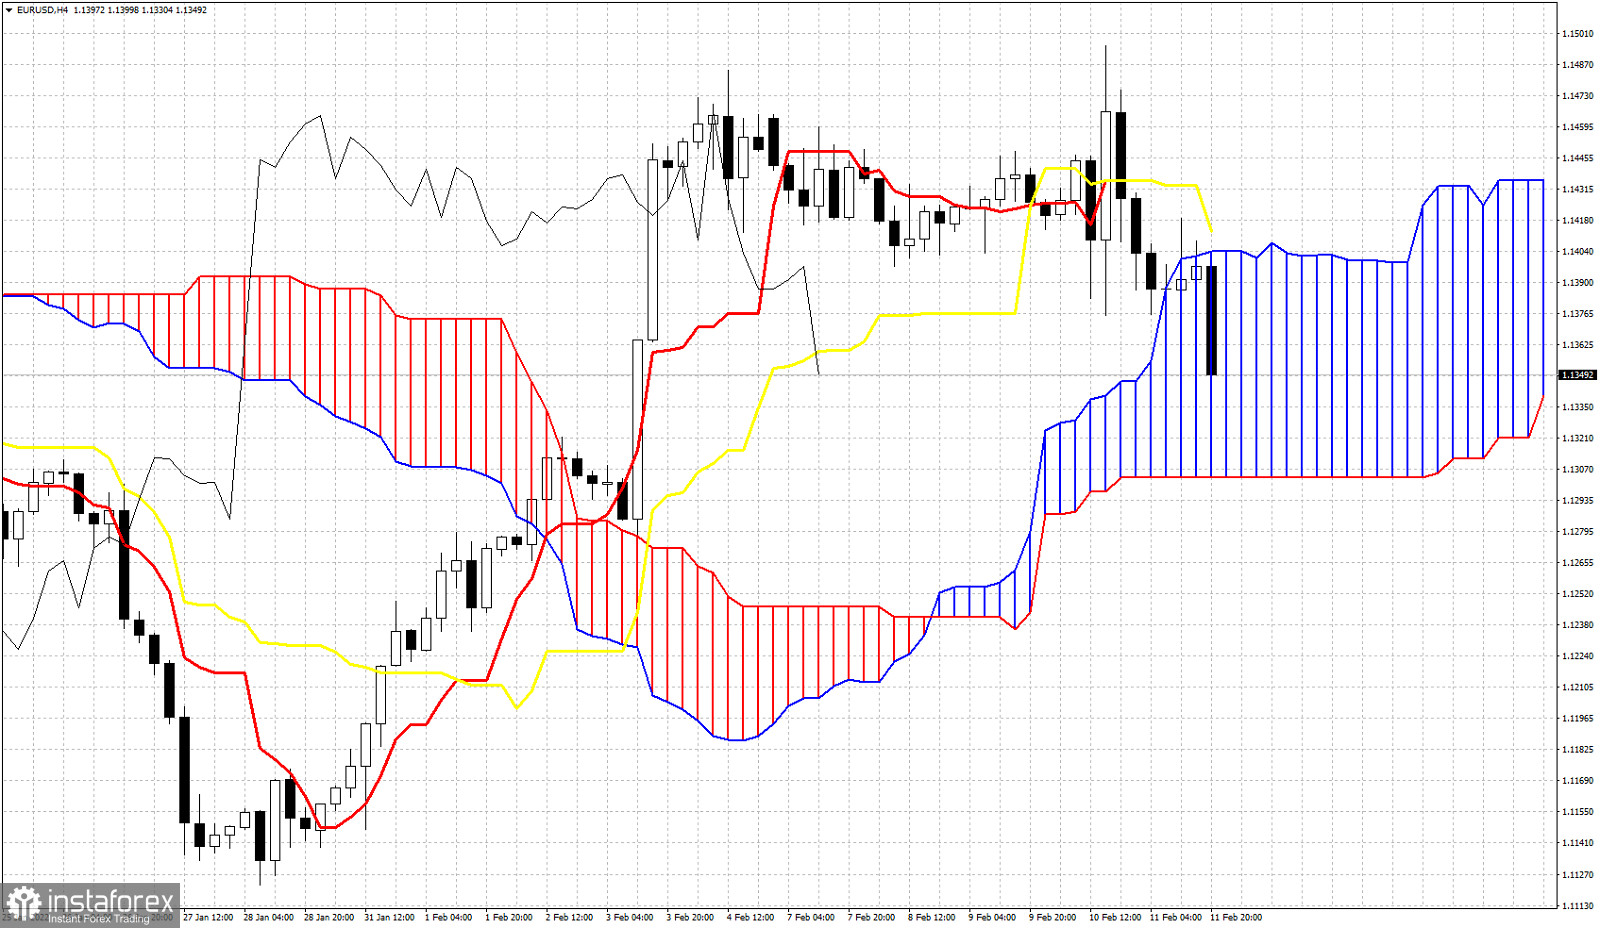
Last week EURUSD ended near its weekly lows after making new weekly highs at 1.1495. Price has entered the Daily Kumo. This is not good for bulls. In Ichimoku cloud terms, price is in a neutral trend as long as it trades inside the Kumo (cloud).
 Relevance until
Last week EURUSD ended near its weekly lows after making new weekly highs at 1.1495. Price has entered the Daily Kumo. This is not good for bulls. In Ichimoku cloud terms, price is in a neutral trend as long as it trades inside the Kumo (cloud).