 English
  Русский
 Bahasa Indonesia
 Bahasa Malay
 ไทย
ไทย Español
 Deutsch
 Български
 Français
 Tiếng Việt
 中文
中文 বাংলা
বাংলা हिन्दी
 Čeština
 Українська
 Română

Trend analysis (Fig. 1)
Today, the market, from the level of 1.3084 (closing of yesterday's daily candle), will try to continue moving down with the goal of 1.2985 which is a pullback level of 38.2% (red dotted line). When this level is reached, the price can start moving up with the next target of 1.3078 which is the pullback level of 50.0% (blue dotted line). When testing this level, further work up with the target 1.3177 upper fractal (red dotted line).
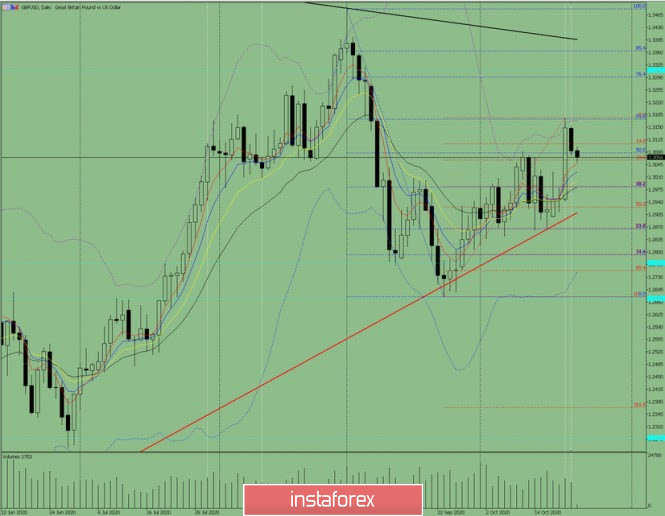
Figure 1 (daily chart).
Complex Analysis
- Indicator Analysis - down
- Fibonacci Levels – down
- Volumes – down
- Technical Analysis – down
- Trend analysis-up
- Bollinger Bands – down
- Weekly Chart - up
General conclusion:
Today, the price from the level of 1.3084 (the closing of yesterday's daily candle) will try to continue moving down with the goal of 1.2985 which is a pullback level of 38.2% (red dotted line). When this level is reached, the price can start moving up with the next target of 1.3078-the pullback level of 50.0% (blue dotted line).
Alternative scenario: when moving down to the retracement level of 38.2% - 1.2985 (red dotted line), the continuation of the downward movement to the next target will be 1.2926 which is the retracement level of 50.0% (red dotted line).