 English
  Русский
 Bahasa Indonesia
 Bahasa Malay
 ไทย
ไทย Español
 Deutsch
 Български
 Français
 Tiếng Việt
 中文
中文 বাংলা
বাংলা हिन्दी
 Čeština
 Українська
 Română

Trend analysis (Fig. 1)
Today, the market may start moving down from the level of 1.1860 (closing of Friday's daily candlestick) in order to reach the pullback level of 23.6% - 1.1817 (red dotted line). If this line is tested, there is a possibility that the downward movement will resume with the target of 1.1786-21 average EMA (black thin line).
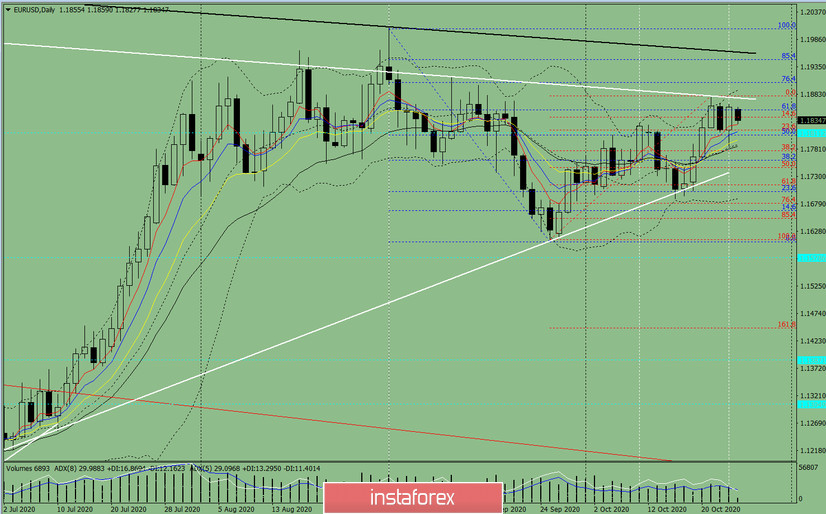
Figure 1 (daily chart).
Comprehensive analysis:
- Indicator analysis - down
- Fibonacci levels - down
- Volumes - down
- Technical analysis - down
- Trend analysis - down
- Bollinger bands - up
- Weekly chart - down
General conclusion:
Today, the price might make a downward movement in order to reach the pullback level of 23.6% - 1.1817 (red dotted line). If this line is tested, it is possible for the downward movement to continue with the target of 1.1786-21 average EMA (black thin line).
Unlikely scenario: from the level of 1.1860 (closing of the Friday day candle) - work down with the target of 1.1817, which is a pullback level of 23.6% (red dotted line). Upon testing this level, work up with the goal of 1.1880 upper fractal (red dotted line), from which the upper work is possible.