 English
  Русский
 Bahasa Indonesia
 Bahasa Malay
 ไทย
ไทย Español
 Deutsch
 Български
 Français
 Tiếng Việt
 中文
中文 বাংলা
বাংলা हिन्दी
 Čeština
 Українська
 Română

To open long positions on GBPUSD, you need:
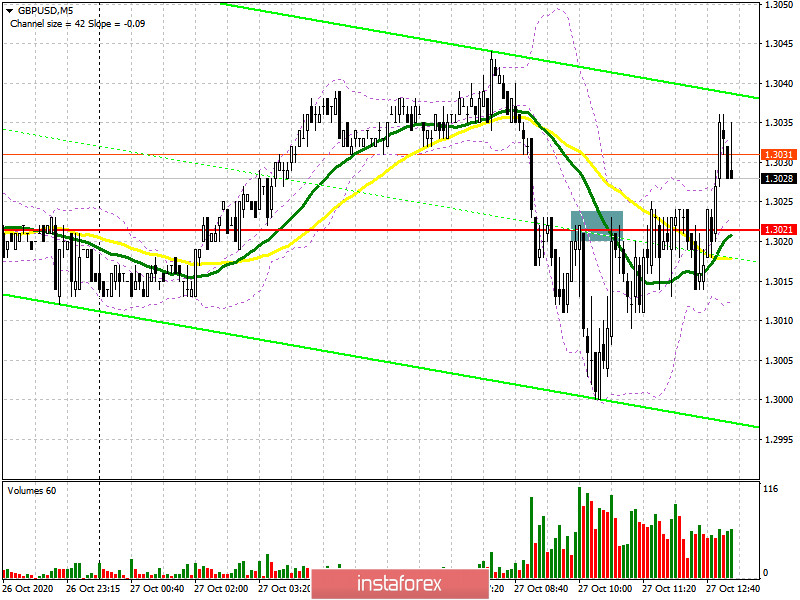
In the first half of the day, I paid attention to sales if the pair was fixed below the level of 1.3021, which happened. Let's look at the 5-minute chart and analyze the entry points. You can see how the bears go under the level of 1.3021 and then test it from the bottom up, forming a good signal to open short positions, which, unfortunately, was not implemented, since the market has no benchmarks due to the Brexit agreement hanging in the air.
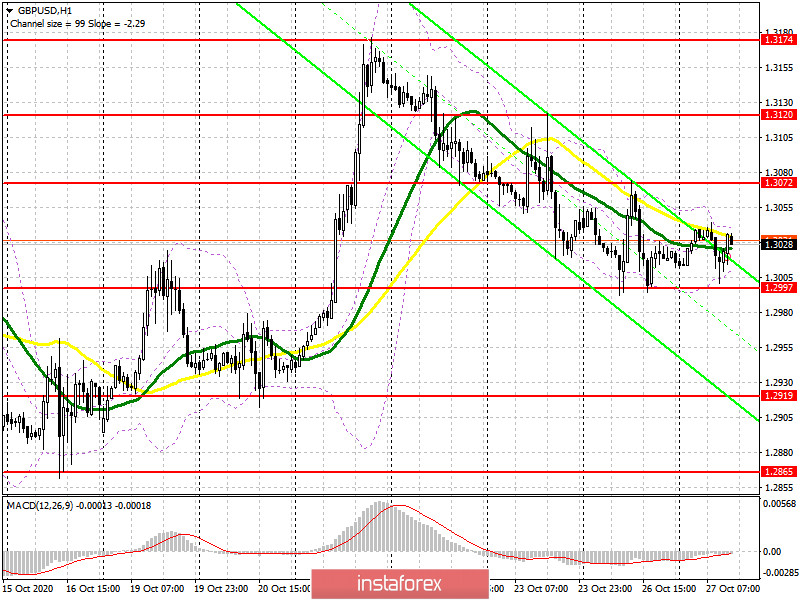
The technical picture for the second half of the day has changed. Given the fact that volatility is quite low, we will not rely on intermediate levels. The main task of the bulls for the second half of the day remains to protect the support of 1.2997. The formation of a false breakout on it will be a signal to open long positions in the expectation of an upward trend towards the maximum of 1.3072. It will be possible to talk about the return of control over the pound by buyers only after fixing above this range, which will form another entry point into long positions to update the maximum of 1.3120, where I recommend fixing the profits. You can expect a larger increase to the area of the maximum of 1.3174 only after the appearance of positive news on Brexit. If there is no activity of buyers in the support area of 1.2997, I recommend that you postpone long positions until the test of the minimum of 1.2919, from which you can buy the pound for a rebound based on a correction of 20-30 points within the day.
To open short positions on GBPUSD, you need:
In the second half of the day, the bears will be aimed at breaking the larger support of 1.2997, and this will happen only in the event of negative news on Brexit or after a more than excellent report on the US consumer confidence indicator, which will strengthen demand for the US dollar. Fixing below 1.2997 forms a good entry point for short positions, which will push GBP/USD further down to the minimum of 1.2919, where I recommend fixing the profits. A longer-term target for sellers in the middle of the week will be the area of 1.2865. If in the second half of the day we will observe the growth of the British pound, then there is no need to hurry with sales. It is best to wait for the formation of a false breakout in the support area of 1.3072 or open short positions immediately for a rebound from the maximum of 1.3120, based on a downward correction of 20-30 points within the day.
Let me remind you that in the COT reports (Commitment of Traders) for October 20, there was a reduction in short and a sharp increase in long positions. Long non-commercial positions increased from the level of 36,195 to the level of 39,836. At the same time, non-commercial short positions dropped from the level of 45,997 to 41,836. As a result, the negative value of the non-commercial net position increased slightly to -2000 against -9,802 a week earlier, which indicates that sellers of the British pound remain in control and have a minimal advantage in the current situation.
Signals of indicators:
Moving averages
Trading is conducted around 30 and 50 daily averages, which is more indicative of the sideways nature of the market before the release of important news.
Note: The period and prices of moving averages are considered by the author on the hourly chart H1 and differ from the general definition of classic daily moving averages on the daily chart D1.
Bollinger Bands
Volatility has decreased, which does not give signals to enter the market.
Description of indicators
- Moving average (moving average determines the current trend by smoothing out volatility and noise). Period 50. The graph is marked in yellow.
- Moving average (moving average determines the current trend by smoothing out volatility and noise). Period 30. The graph is marked in green.
- MACD indicator (Moving Average Convergence / Divergence - moving average convergence / divergence) Fast EMA period 12. Slow EMA period 26. SMA period 9
- Bollinger Bands (Bollinger Bands). Period 20
- Non-profit speculative traders, such as individual traders, hedge funds, and large institutions that use the futures market for speculative purposes and meet certain requirements.
- Long non-commercial positions represent the total long open position of non-commercial traders.
- Short non-commercial positions represent the total short open position of non-commercial traders.
- Total non-commercial net position is the difference between the short and long positions of non-commercial traders.