 English
  Русский
 Bahasa Indonesia
 Bahasa Malay
 ไทย
ไทย Español
 Deutsch
 Български
 Français
 Tiếng Việt
 中文
中文 বাংলা
বাংলা हिन्दी
 Čeština
 Українська
 Română

To open long positions on EUR/USD, you need:
Sell positions for the euro collapsed yesterday, and the bulls tried to regain resistance at 1.1826 and they even managed to form a good entry point from it. Let's take a look at the 5-minute chart. You can see how testing the 1.1826 level from top to bottom, which was supposed to be a confirmation and a signal to open long positions in EUR/USD, turned out to be unsuccessful and the pair quickly returned below the 1.1826 area. After that, the bears formed a fairly convenient entry point into short positions, which led to a new wave of short positions. However, the euro did not continue to fall and buyers still managed to gain a foothold above 1.1826 in the afternoon, but they did not wait for a good growth from this level. US President Donald Trump's statements and the spread of the coronavirus continued to put pressure on the euro, as did weak fundamental reports on the American economy, scaring away investors who are betting on risky assets.
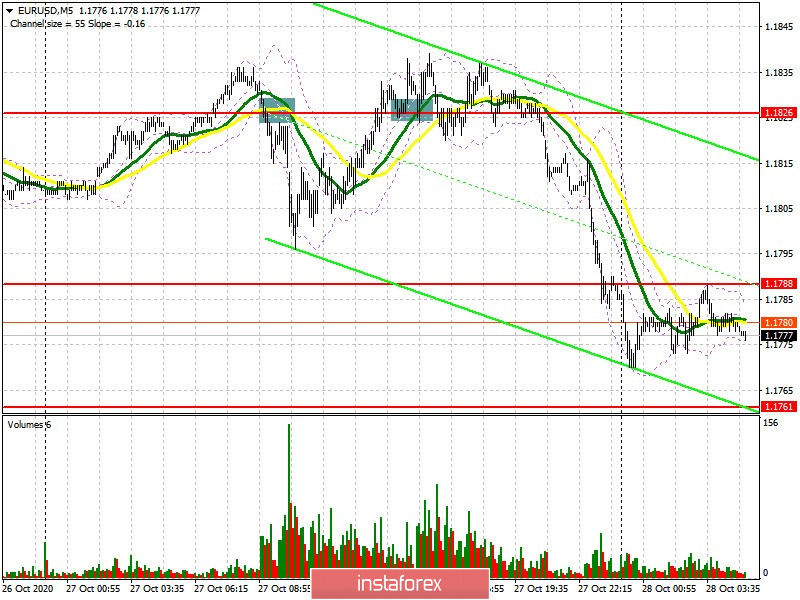
Today's focus will be on the resistance at 1.1796, which transformed from 1.1787. In order to talk about the resumption of the bull market, buyers need to settle above this range. Testing the 1.1796 area from top to bottom generates a signal to buy EUR/USD in order to return to yesterday's high at 1.1835, where I recommend taking profit. The 1.1864 level will be the next target. Buyers of the euro are unlikely to be as active since important fundamental data will not be released in the first half of the day. If the euro is still under pressure, I recommend waiting for EUR/USD to fall to the support area of 1.1761 and open long positions there if a false breakout is formed. You can buy the pair immediately on a rebound after the next low at 1.1732 has been tested, counting on a correction of 15-20 points within the day.
The Commitment of Traders (COT) report for October 20 recorded an increase in long positions and short ones. However, there were more of the latter, which led to an even greater decrease in the positive delta. Despite this, the buyers of risky assets believe in the continuation of the bull market, but prefer to act with caution, as there is no good news for the eurozone yet. Thus, long non-commercial positions increased from 228,295 to 229,878, while short non-commercial positions increased from 59,658 to 63,935. The total non-commercial net position decreased to 165,943, against 168,637 a week earlier.... However, the bullish sentiment for the euro remains rather high in the medium term. The more the euro falls against the US dollar at the end of this year, the more attractive it is for new investors.
To open short positions on EUR/USD, you need:
Sellers should protect resistance at 1.1796, just above which the moving averages pass. Considering that we have a downward trend, it is better to expect that it would continue today. Therefore, forming a false breakout in the 1.1796 area forms a new entry point for short positions, and the main target will be a breakout and the pair will need to settle below the 1.1761 level. Testing it from the bottom up forms another signal to sell the euro, which will lead to a larger sale in the area of a low of 1.1732. The 1.1704 level will be the next target, where I recommend taking profits. If we don't hear positive news on Brexit today, it will keep the pressure on the euro even more. If the pair rises above 1.1796 and bears are not active there, I recommend postponing short positions and sell the euro immediately on a rebound from yesterday's high of 1.1835, counting on a correction of 15-20 points within the day.
Indicator signals:
Moving averages
Trading is under the 30 and 50 moving averages, indicating a resumption of the bear market.
Note: The period and prices of moving averages are considered by the author on the H1 hourly chart and differs from the general definition of the classic daily moving averages on the daily D1 chart.
Bollinger Bands
A breakout of the lower border of the indicator around 1.1761 will increase pressure on the euro. Growth will be limited by the upper level of the indicator in the 1.1840 area.
Description of indicators
- Moving average (moving average, determines the current trend by smoothing out volatility and noise). Period 50. It is marked in yellow on the chart.
- Moving average (moving average, determines the current trend by smoothing out volatility and noise). Period 30. It is marked in green on the chart.
- MACD indicator (Moving Average Convergence/Divergence — convergence/divergence of moving averages) Quick EMA period 12. Slow EMA period to 26. SMA period 9
- Bollinger Bands (Bollinger Bands). Period 20
- Non-commercial speculative traders, such as individual traders, hedge funds, and large institutions that use the futures market for speculative purposes and meet certain requirements.
- Long non-commercial positions represent the total long open position of non-commercial traders.
- Short non-commercial positions represent the total short open position of non-commercial traders.
- Total non-commercial net position is the difference between short and long positions of non-commercial traders.