 English
  Русский
 Bahasa Indonesia
 Bahasa Malay
 ไทย
ไทย Español
 Deutsch
 Български
 Français
 Tiếng Việt
 中文
中文 বাংলা
বাংলা हिन्दी
 Čeština
 Українська
 Română

Trend analysis (Fig. 1).
Today, the market will try to continue moving up from the level of 1.3043 (closing of yesterday's daily candle) in order to reach the pullback level of 61.8% - 1.3173 (blue dotted line). If this level is tested, a pullback may begin down to the target of 1.3104 which is a pullback level of 14.6% (red dotted line).
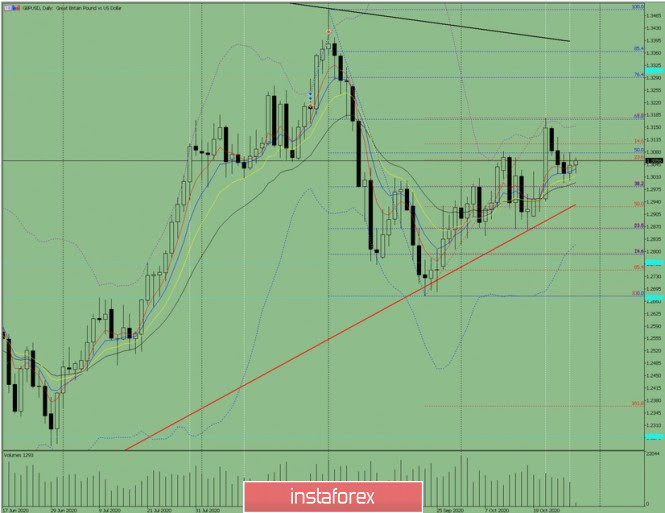
Figure 1 (daily chart).
Complex analysis:
- Indicator Analysis – up
- Fibonacci Levels – up
- Volumes – up
- Candle Analysis-up
- Trend Analysis – down
- Bollinger Bands – up
- Weekly Chart – up
General conclusion:
The price, from the level of 1.3043 (closing of yesterday's daily candle), will try to continue moving up to reach the pullback level of 61.8% - 1.3173 (blue dotted line). If this level is tested, a pullback may begin down to the target of 1.3104 which is a pullback level of 14.6% (red dotted line).
Unlikely scenario: The price, from the level of 1.3043 (closing of yesterday's daily candle), will work up to reach the 50% pullback level-1.3078 (blue dotted line). In the case of testing this level-work down to the goal of 1.2986 which is a pullback level of 38.2% (red dotted line)