 English
  Русский
 Bahasa Indonesia
 Bahasa Malay
 ไทย
ไทย Español
 Deutsch
 Български
 Français
 Tiếng Việt
 中文
中文 বাংলা
বাংলা हिन्दी
 Čeština
 Українська
 Română

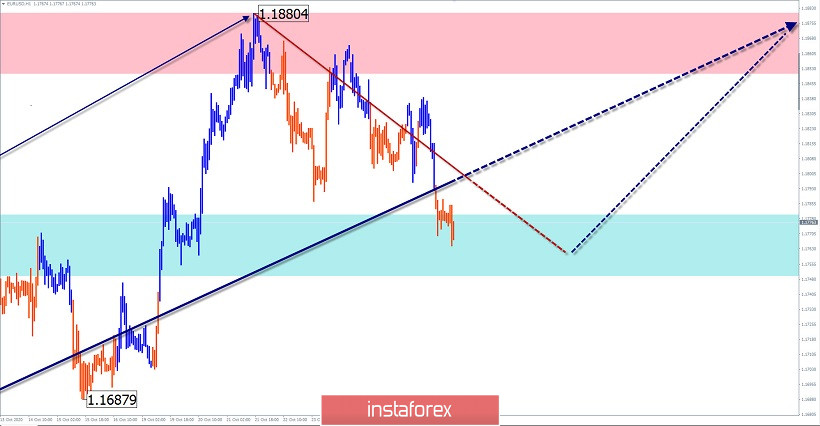
EUR/USD
Analysis:
The direction of the medium-term trend of the European currency since March is set by an upward wave. Its last section counts down from September 25. The wave structure started forming a downward correction a week ago. The price is very close to a strong potential reversal zone.
Forecast:
Over the next 24 hours, we expect the end of the downward movement, the formation of a reversal, and the beginning of a price rise. A breakout of the upper limit of the resistance zone is possible today, but unlikely.
Potential reversal zones
Resistance:
- 1.1850/1.1880
Support:
- 1.1780/1.1750
Recommendations:
Selling euros today is risky and not recommended. It is more promising to search for signals to buy the instrument in the area of settlement support.
AUD/USD
Analysis:
The chart of the main pair of the Australian dollar is dominated by an upward trend. Short-term price fluctuations are set by the rising wave from September 25. In its structure, the formation of the final part (C) began on October 20. Since last week, the chart has been sideways flat. It forms the correction phase necessary before the subsequent upward surge.
Forecast:
Today, we expect the end of the sideways movement mood and the beginning of price growth. At the European session, a second decline in the support area is possible. The calculated resistance zone is intermediate and can only hold the price of the pair until the end of the day.
Potential reversal zones
Resistance:
- 0.7190/0.7220
Support:
- 0.7130/0.7100
Recommendations:
There are no conditions for "Aussie" sales today. At the end of oncoming movements, it is recommended to track the emerging reversal signals to buy the pair.
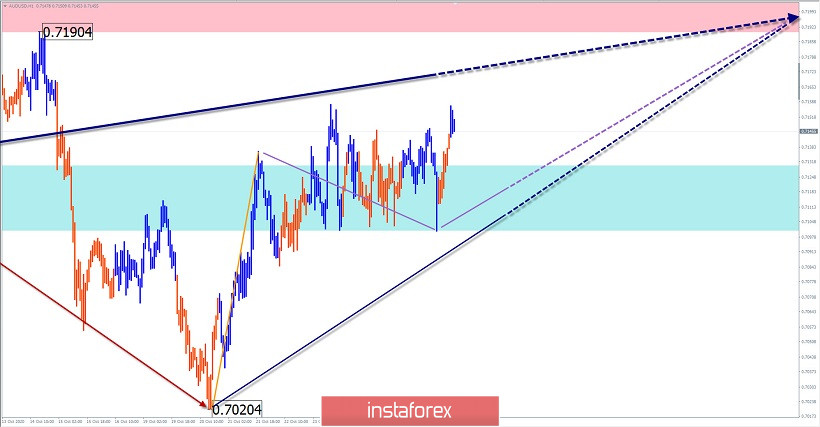
Explanation: In the simplified wave analysis (UVA), waves consist of 3 parts (A-B-C). The last incomplete wave is analyzed. The solid background of the arrows shows the formed structure, and the dotted background shows the expected movements.
Note: The wave algorithm does not take into account the duration of the instrument's movements in time!