 English
  Русский
 Bahasa Indonesia
 Bahasa Malay
 ไทย
ไทย Español
 Deutsch
 Български
 Français
 Tiếng Việt
 中文
中文 বাংলা
বাংলা हिन्दी
 Čeština
 Українська
 Română

To open long positions on GBP/USD, you need:
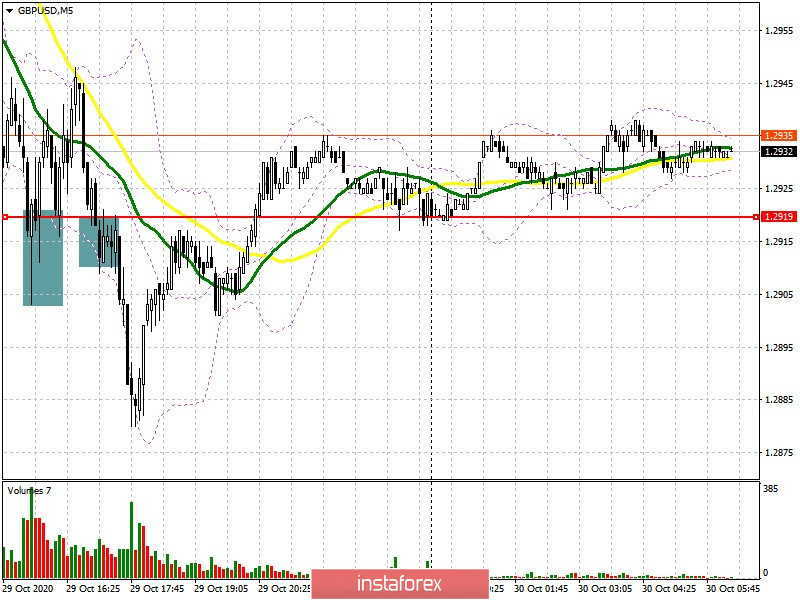
Buyers of the British pound were desperately fighting for support at 1.2919 and they even managed to form a signal to buy the pound from it in the afternoon. Take a look at the 5-minute chart. You can see how several false breakouts of the 1.2919 support formed a good entry point into long positions, the growth was worth around 25 points, after which the bulls fizzled out. Falling under the 1.2919 level closer to the middle of the US session and testing this level from the bottom up formed a signal to sell the pound, afterwards the pair fell by around 40 points.
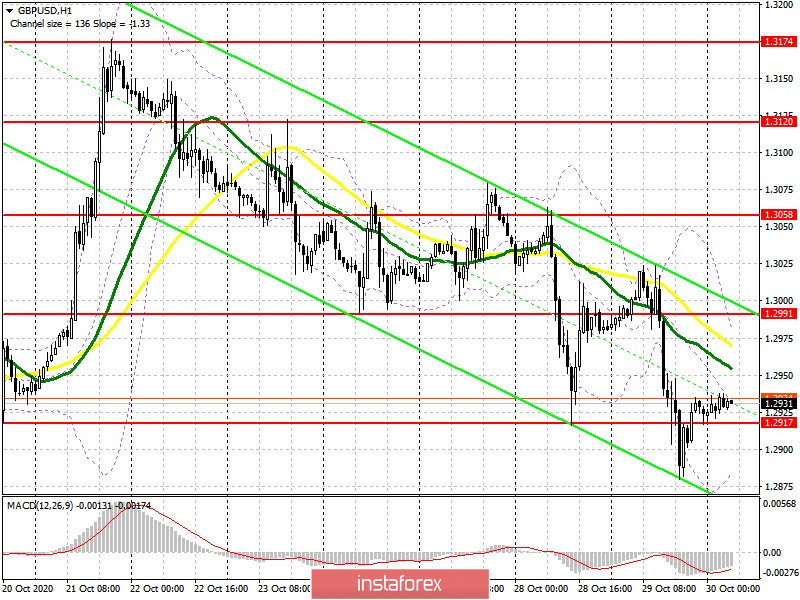
The technical picture has not changed much compared to yesterday. The lack of Brexit news weighs on both buyers and sellers. Buyers have a chance for a market reversal, and for this they need to prevent a breakout of support at 1.2917. Forming a false breakout on it will be the first signal to open long positions. If there is no activity there, I recommend postponing long deals until the 1.2865 low has been updated, which we did not reach yesterday. From there, you can open buy positions immediately on a rebound, counting on a correction of 20-30 points within the day. But it is possible to speak of a more probable recovery and a change in the trend once the pair has settled above the resistance of 1.2991, slightly below which the moving averages passes, playing on the side of the sellers of the pound.Testing the 1.2991 area on the reverse side forms a new entry point for long deals with the goal of updating highs of 1.3058 and 1.3120, where I recommend taking profits.
The Commitment of Traders (COT) report for October 20 showed a reduction in short positions and a sharp increase in long positions. Long non-commercial positions rose from 36,195 to 39,836. At the same time, short non-commercial positions fell from 45,997 to 41,836. As a result, the negative value of the non-commercial net position slightly increased and reached -2,000, against - 9,802 a week earlier, which indicates that the sellers of the pound retain control and also shows their minimal advantage in the current situation.
To open short positions on GBP/USD, you need:
Bears aim to regain control of support at 1.2917. A breakout and being able to settle below this level will be a signal to open new short positions in sustaining the downward trend and with the main goal of updating a fairly large low of 1.2865, which has already been tested four times this month. A breakthrough of this range will cause GBP/USD to drop and reach a low of 1.2807 and 1.2749, where I recommend taking profits. Negative Brexit news and the absence of a trade deal could increase the pressure on the pair. In case of an upward correction, you can pay attention to forming a false breakout in the resistance area of 1.2991, which will be a signal to sell the pound in order to continue the current trend.
Indicator signals:
Moving averages
Trading is carried out slightly below the 30 and 50 moving averages, which indicates that the pair is still under pressure.
Note: The period and prices of moving averages are considered by the author on the H1 hourly chart and differs from the general definition of the classic daily moving averages on the daily D1 chart.
Bollinger Bands
A breakout of the upper border of the indicator in the 1.2965 area will lead to a new wave of growth of the pound. A breakout of the lower border of the indicator in the 1.2885 area will increase the pressure on the pair.
Description of indicators
- Moving average (moving average, determines the current trend by smoothing out volatility and noise). Period 50. It is marked in yellow on the chart.
- Moving average (moving average, determines the current trend by smoothing out volatility and noise). Period 30. It is marked in green on the chart.
- MACD indicator (Moving Average Convergence/Divergence — convergence/divergence of moving averages) Quick EMA period 12. Slow EMA period to 26. SMA period 9
- Bollinger Bands (Bollinger Bands). Period 20
- Non-commercial speculative traders, such as individual traders, hedge funds, and large institutions that use the futures market for speculative purposes and meet certain requirements.
- Long non-commercial positions represent the total long open position of non-commercial traders.
- Short non-commercial positions represent the total short open position of non-commercial traders.
- Total non-commercial net position is the difference between short and long positions of non-commercial traders.