 English
  Русский
 Bahasa Indonesia
 Bahasa Malay
 ไทย
ไทย Español
 Deutsch
 Български
 Français
 Tiếng Việt
 中文
中文 বাংলা
বাংলা हिन्दी
 Čeština
 Українська
 Română

Trend analysis (Fig. 1).
Today, the market from the level of 1.2929 (closing of yesterday's daily candlestick) will attempt to continue moving down with the goal of 1.2868, which is a pullback level of 61.8% (red dotted line). When this level is reached, the price may resume moving down to the next target of 1.2794, which is a pullback level of 76.4% (red dotted line).
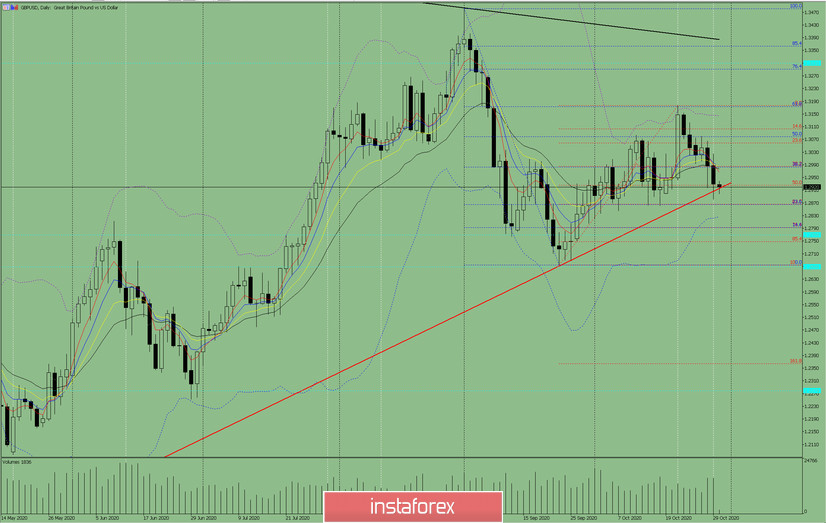
Figure 1 (Daily chart).
Comprehensive analysis:
- Indicator analysis - down
- Fibonacci levels - down
- Volumes - down
- Candlestick analysis - down
- Trend analysis - up
- Bollinger bands - down
- Weekly chart - up
General conclusion:
Today, the price from the level of 1.2929 (closing of yesterday's daily candlestick) will attempt to continue moving down with the goal of 1.2868, which is a pullback level of 61.8% (red dotted line). When this level is reached, the price may continue to move down to the next target of 1.2794, which is a pullback level of 76.4% (red dotted line).
Alternative scenario: from the level of 1.2929 (closing of yesterday's daily candlestick), the price will start moving up to reach the pullback level of 38.2% - 1.2983 (blue dotted line). When testing this level, there will be a continuation of the upward movement to the next target 1.3078, which is a pullback level of 50.0% (blue dotted line).