 English
  Русский
 Bahasa Indonesia
 Bahasa Malay
 ไทย
ไทย Español
 Deutsch
 Български
 Français
 Tiếng Việt
 中文
中文 বাংলা
বাংলা हिन्दी
 Čeština
 Українська
 Română

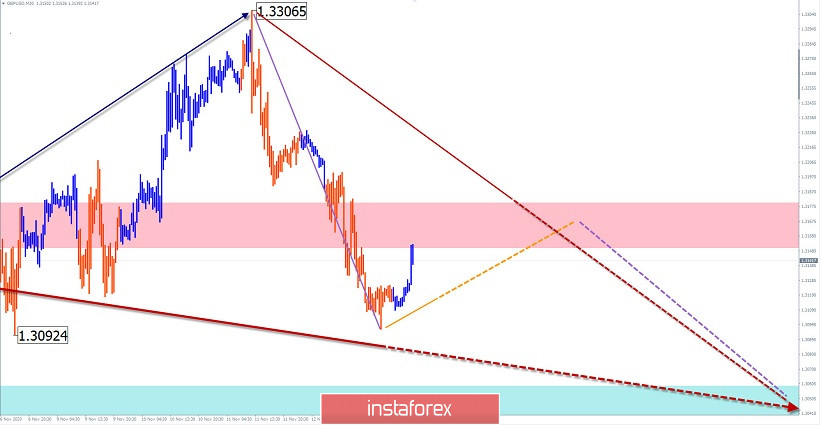
GBP/USD
Analysis:
On the chart of the British pound, the price movements of the last three months form a flat upward wave. It can end the correction phase of a larger wave model or be the beginning of its next trend part. In the structure of this movement, a complex correction in the form of a shifting plane is nearing completion.
Forecast:
The pair's overall downward mood is expected today. In the European session, a short-term rise in the price to the resistance area is possible. Higher or lower volatility is likely by the end of the day.
Potential reversal zones
Resistance:
- 1.3150/1.3180
Support:
- 1.3060/1.3030
Recommendations:
Before the end of the current downward wave, the pound may be sold in a reduced lot. After the reversal signals appear in the area of settlement support, you should track the signals for buying the pair.
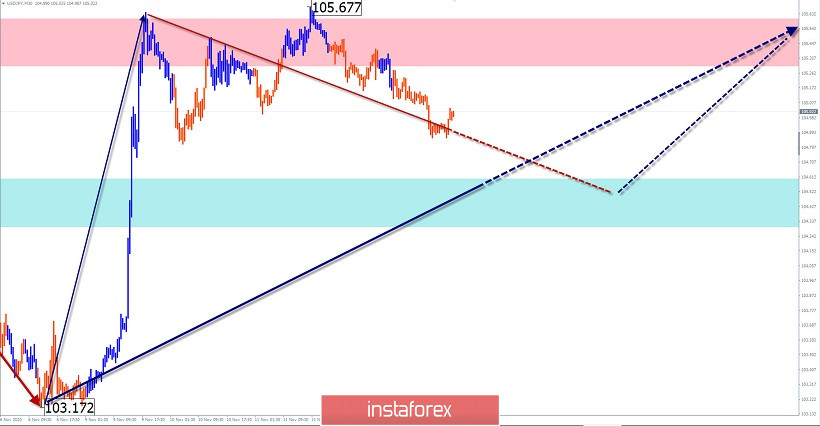
USD/JPY
Analysis:
The upward section of the chart from November 6, which started from strong support, has a powerful reversal potential. The price has reached an intermediate resistance, from which a correction has been formed in recent days.
Forecast:
In the next 24 hours, the price is likely to move sideways between the opposite zones. In the first half, a downward vector is more likely. You can expect a change in the exchange rate and a price rise at the end of the day or the beginning of the next week.
Potential reversal zones
Resistance:
- 105.30/105.70
Support:
- 104.60/104.30
Recommendations:
Today, trading is only possible within the intraday with a reduced lot, according to the expected sequence. It is safer to refrain from entering the pair's market until buy signals appear.
Explanation: In the simplified wave analysis (UVA), waves consist of 3 parts (A-B-C). The last incomplete wave is analyzed. The solid background of the arrows shows the formed structure, and the dotted background shows the expected movements.
Note: The wave algorithm does not take into account the duration of the instrument's movements in time!