 English
  Русский
 Bahasa Indonesia
 Bahasa Malay
 ไทย
ไทย Español
 Deutsch
 Български
 Français
 Tiếng Việt
 中文
中文 বাংলা
বাংলা हिन्दी
 Čeština
 Українська
 Română

Trend analysis (Fig. 1).
Today, the market may continue to move up from the level of 1.1835 (Friday's daily candle close), in order to reach the resistance line-1.1857 (white bold line). If this line will be tested, an upward movement will most likely continue with the target of 1.1920 at the upper fractal (red dotted line).
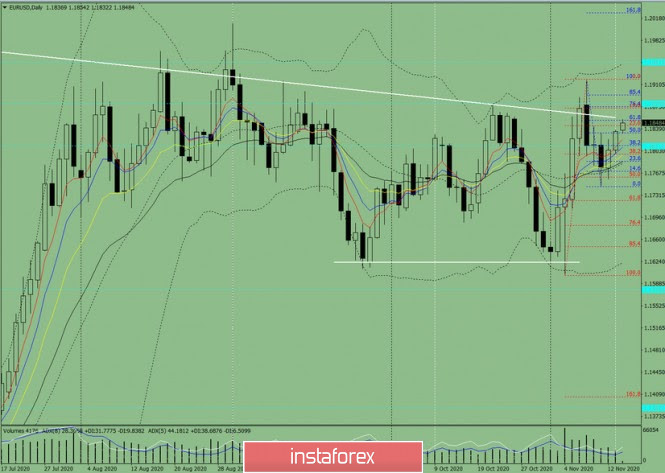
Figure 1 (daily chart).
Complex Analysis:
- Indicator Analysis - up
- Fibonacci Levels - up
- Volumes - up
- Candle Analysis - up
- Trend Analysis - up
- Bollinger Bands - up
- Weekly Chart - up
General Conclusion:
Today, the price may move up to reach the resistance line-1.1857 (white bold line). If this line will be tested, the upward movement will most likely continue with the target of 1.1920 at the upper fractal (red dotted line).
Alternative scenario: from the level of 1.1835 (closing of the Friday daily candle) it will go up to reach the resistance line of 1.1857 (white bold line). If this line will be tested, it will go down with the target of 1.1644 – a pullback level of 38.2% (red dotted line).