 English
  Русский
 Bahasa Indonesia
 Bahasa Malay
 ไทย
ไทย Español
 Deutsch
 Български
 Français
 Tiếng Việt
 中文
中文 বাংলা
বাংলা हिन्दी
 Čeština
 Українська
 Română

Litecoin bounced back after reaching the 91.52 level. Now, it's trading at 106.05 at the time of writing. The price action developed a potential bullish reversal pattern, Still, we'll have to wait for strong confirmation before taking action.
LTC/USD is up by 17.26% from yesterday's low of 91.52 to today's high of 107.32. In the short term, the bias remains bearish as long as it stays under the immediate resistance levels. In the short term, Litecoin rallied after the price of Bitcoin turned to the upside.
LTC/USD Within A Demand Zone!
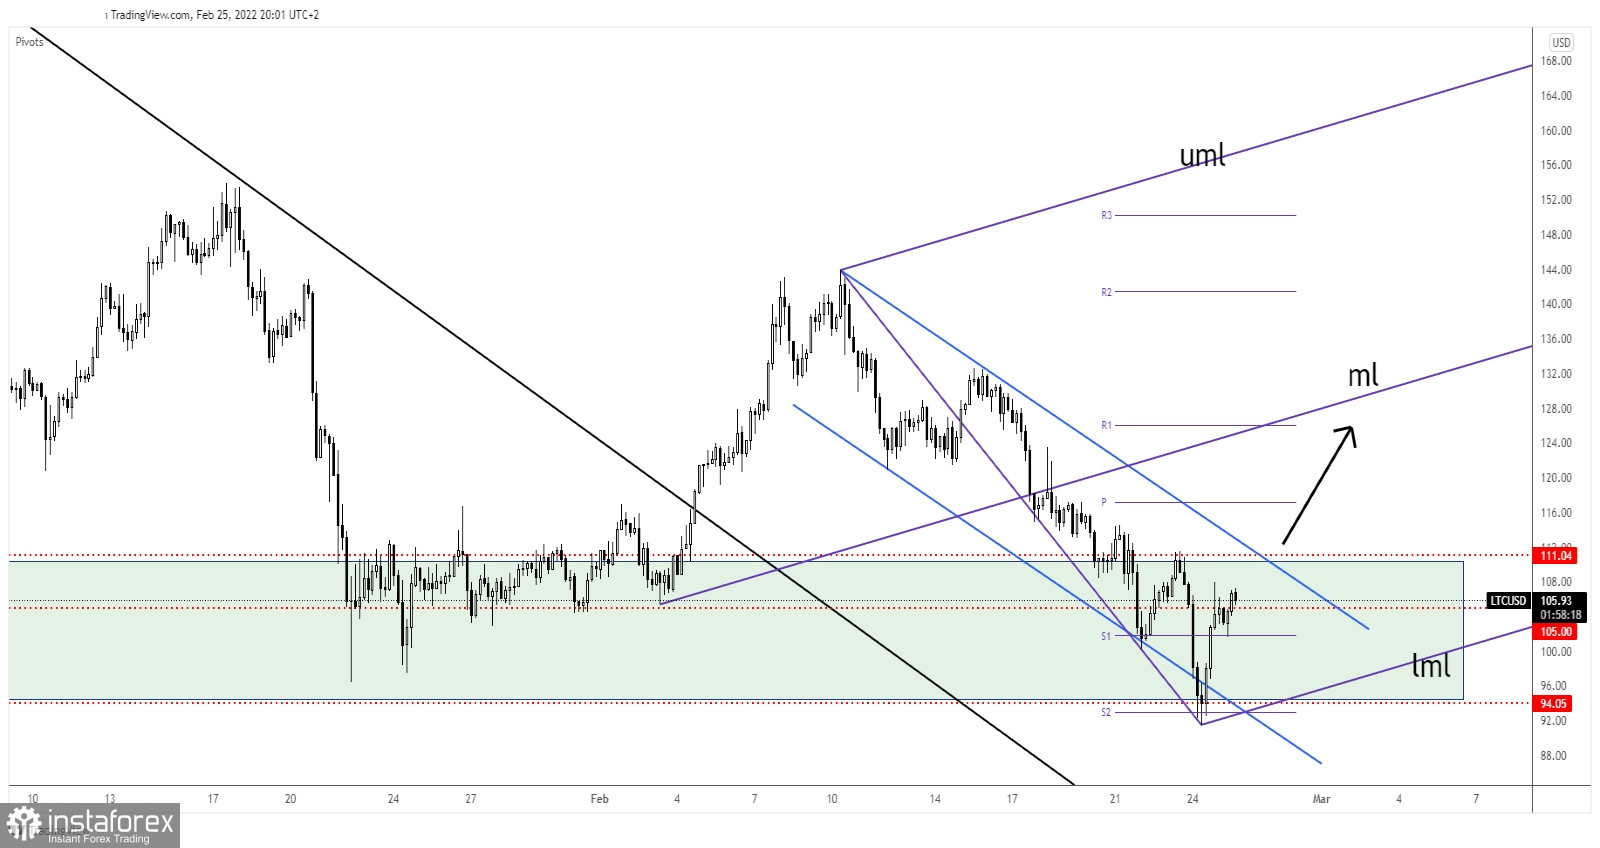
LTC/USD dropped within a down-channel pattern. As you can see, it has registered only a false breakdown below 94.05 static support and through the channel's downside line. Now, it has registered strong growth and it's almost to reach the downtrend line.
Personally, I've drawn an ascending pitchfork hoping that I'll catch a new leg higher. Still, only a valid breakout above the downtrend line may announce a larger growth and could bring new long opportunities.
LTC/USD Prediction!
The downtrend line and the 111.04 represent near-term resistance levels. Actually, we have a strong confluence area at the intersection between these levels. A valid breakout through this confluence area may announce an upside continuation and could bring new long opportunities with a first potential target at the median line (ml).