 English
  Русский
 Bahasa Indonesia
 Bahasa Malay
 ไทย
ไทย Español
 Deutsch
 Български
 Français
 Tiếng Việt
 中文
中文 বাংলা
বাংলা हिन्दी
 Čeština
 Українська
 Română

Trend analysis (Fig. 1).
Today, the market will try to continue moving upward from the level of 1.3242 (closing of yesterday's daily candlestick) in order to reach the resistance line of 1.3309 (white bold line). If this line is tested, further upward movement with the target of 1.3380 is the upper border of the Bollinger line indicator (black dotted line).
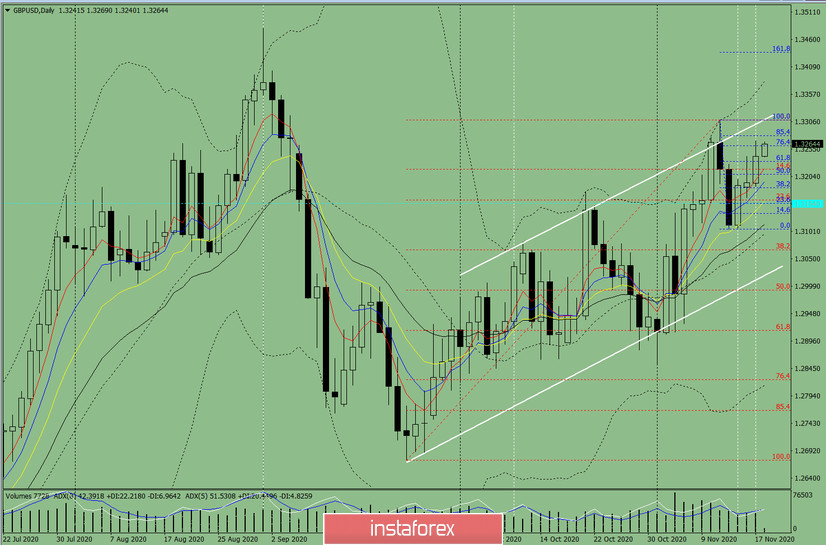
Figure 1 (Daily Chart).
Comprehensive analysis:
- Indicator analysis - up
- Fibonacci levels - up
- Volumes - up
- Candlestick analysis - down
- Trend analysis - up
- Bollinger bands - up
- Weekly chart - up
General conclusion:
Today, the price will try to continue moving upward from the level of 1.3242 (closing of yesterday's daily candlestick) to reach the resistance line of 1.3309 (white bold line). If this line is tested, further upward movement with the target of 1.3380 is the upper border of the Bollinger line indicator (black dotted line).
Unlikely scenario: the price will try to continue moving upward from the level of 1.3242 (closing of yesterday's daily candlestick) to reach the resistance line of 1.3309 (white bold line). If this line is tested, it will work down to the target of 1.3216 with a 14.6% pullback level (red dotted line).