 English
  Русский
 Bahasa Indonesia
 Bahasa Malay
 ไทย
ไทย Español
 Deutsch
 Български
 Français
 Tiếng Việt
 中文
中文 বাংলা
বাংলা हिन्दी
 Čeština
 Українська
 Română

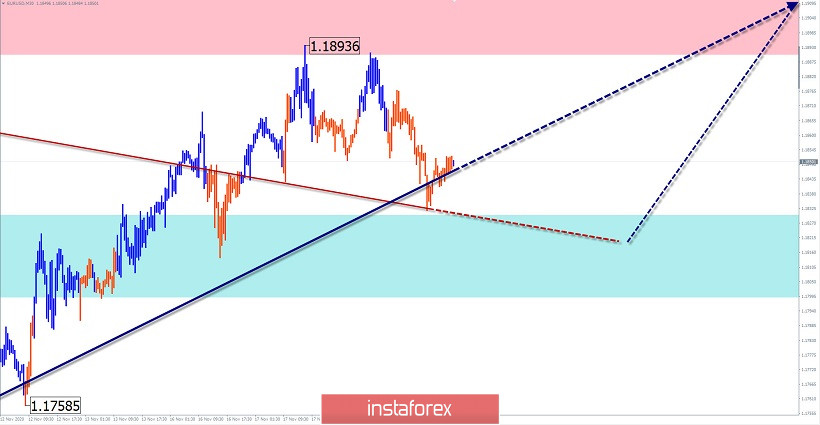
EUR/USD
Analysis:
The direction of the European currency exchange rate in the last six months is set by an upward trend. Its last section started on November 4. A flat correction is formed in the wave structure, which is still incomplete. It looks like a horizontal triangle. The movement has entered its final phase.
Forecast:
Today, we expect the end of the downward movement vector, the formation of a reversal, and the beginning of a price rise. If the exchange rate changes, there may be a sharp increase in volatility.
Potential reversal zones
Resistance:
- 1.1890/1.1920
Support:
- 1.1830/1.1800
Recommendations:
Trading in the euro market is risky until the current decline is completed. After the reversal signals appear in the area of the support zone, it is recommended to buy the pair.
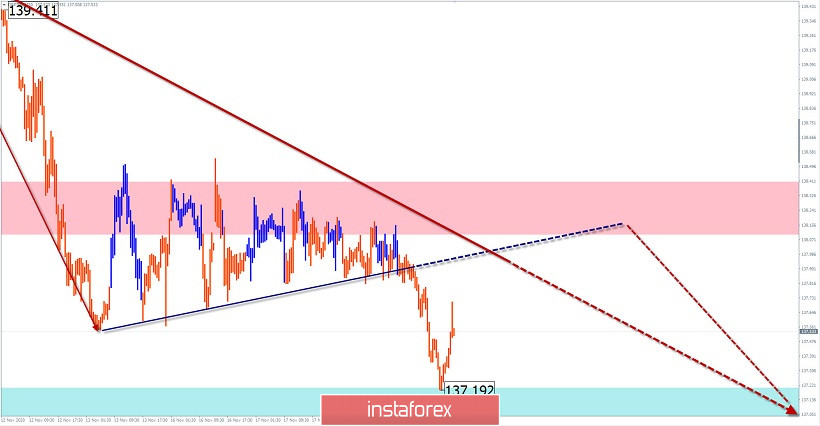
GBP/JPY
Analysis:
All price movements of the pair in recent months form a downward wave. On the daily TF, this is a correction of the previous march section of the bullish trend. The last unfinished section counts down from November 9. Since last week, the price forms a flat correction within it.
Forecast:
Today, the price is expected to move mainly in the lateral plane. The boundaries of the price corridor are the nearest counter zone. An upward vector is more likely in the European session. You can expect a return to the downward rate at the end of the day or tomorrow.
Potential reversal zones
Resistance:
- 138.10/138.40
Support:
- 137.20/136.90
Recommendations:
Trading in the pair's market today can be very risky. It is optimal to refrain from transactions until the end of the ascending section and look for sell signals at its end.
Explanation: In the simplified wave analysis (UVA), waves consist of 3 parts (A-B-C). The last incomplete wave is analyzed. The solid background of the arrows shows the formed structure, and the dotted background shows the expected movements.
Note: The wave algorithm does not take into account the duration of the instrument's movements in time!