 English
  Русский
 Bahasa Indonesia
 Bahasa Malay
 ไทย
ไทย Español
 Deutsch
 Български
 Français
 Tiếng Việt
 中文
中文 বাংলা
বাংলা हिन्दी
 Čeština
 Українська
 Română

The euro/dollar pair was moving in a sideways channel last week, and failed to break up the resistance line 1.1883 (white thick line) again, but the price closed below this line in the end. This week, the market may increase.
Trend analysis:
The price from the level of 1.1855 (closing of the last weekly candle) may start rising this week, with the goal at 1.1920 upper fractal (red dotted line). After testing this line, it can likely further rise towards the next goal, that is, the level of 1.2010 – the upper fractal (weekly candle from 08/30/2020). Upon reaching this level, we can continue to trade upwards.
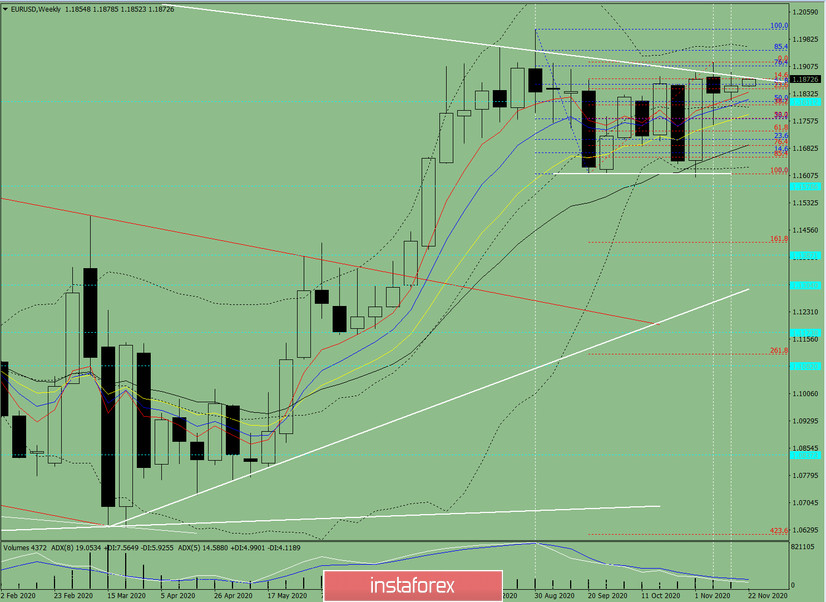
Figure 1 (weekly chart)
Comprehensive analysis:
- indicator analysis - up;
- Fibonacci levels - up;
- volumes - up;
- candlestick analysis - up;
- trend analysis - down;
- Bollinger lines - up;
- monthly chart - up.
Growth can be concluded based on a comprehensive analysis.
The overall result of the candlestick calculation of the EUR/USD currency pair on the weekly chart: the price is likely to have an upward trend this week, with no lower shadow in the weekly white candlestick (Monday - up) and no upper shadow (Friday - up).
The first goal above is the resistance line 1.1883 (white thick line). After testing this line, it is possible to rise towards the next goal at 1.1908 - the pullback level of 76.4% (blue dashed line). Upon reaching this level, further growth can be expected towards the level of 1.1951 - the pullback level of 85.4% (blue dotted line).
An alternative scenario: rising from the level of 1.1835 (closing of the last weekly candle) with the goal located at the resistance line 1.1883 (white thick line) can be considered. If this line is tested, there will be a decline towards the goal at 1.1802 - the pullback level of 38.2% (red dotted line). After testing this level, the price is likely to further decline to the goal of 1.1765 - the pullback level of 50.0% (red dotted line).