 English
  Русский
 Bahasa Indonesia
 Bahasa Malay
 ไทย
ไทย Español
 Deutsch
 Български
 Français
 Tiếng Việt
 中文
中文 বাংলা
বাংলা हिन्दी
 Čeština
 Українська
 Română

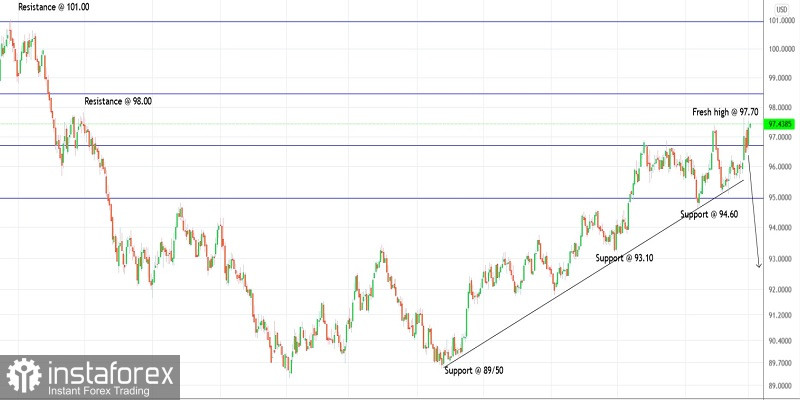
Technical outlook:
The US dollar index is inching higher towards 97.50 as we move into the early European session on Wednesday. The index might be pushing through a new swing high above 97.70 mark to complete the structure. Please note that strong price resistance is seen around 98.00 as depicted on the daily chart. Bears are expected to come back strong thereafter.
The US dollar index might be into its last leg rally close to 98.00 accompanied by a bearish divergence on the daily RSI (not shown here). It could be an indication of a major top being carved close to 97.70-98.00 levels before turning lower. Immediate price support is seen around 95.00 levels and a break below that will confirm a top is in place.
The overall larger degree wave structure for US dollar index is also depicting a bearish structure. The index hed dropped between 104.00 and 89.20 levels carving a meaningful bearish boundary. It has new retraced the above close to fibonacci 0.618 levels as seen on the chart here. High probability remains for a bearish turn from here soon.
Trading plan:
Potential drop through 95.00 and 93.00 levels aginst 98.00
Good luck!