 English
  Русский
 Bahasa Indonesia
 Bahasa Malay
 ไทย
ไทย Español
 Deutsch
 Български
 Français
 Tiếng Việt
 中文
中文 বাংলা
বাংলা हिन्दी
 Čeština
 Українська
 Română

Yesterday, the pair moved upward and tested the pullback level of 85.4% - 1.1894 (blue dotted line), and then it went down, testing the lower pullback level of 38.2% (red dotted line). Today, the price may continue its upward movement. As per the economic calendar, news is expected at 07.00, 09.00, 14.00 UTC for the euro and 15.00 UTC for the dollar.
Trend analysis (Fig. 1).
Today, from the level of 1.1839 (closing of yesterday's daily candlestick), the market can continue to move upward with the target of the 1.1880 resistance line (white bold line). After testing this line, the price will continue to work upward with the target of 1.1920 - the upper fractal (red dotted line).
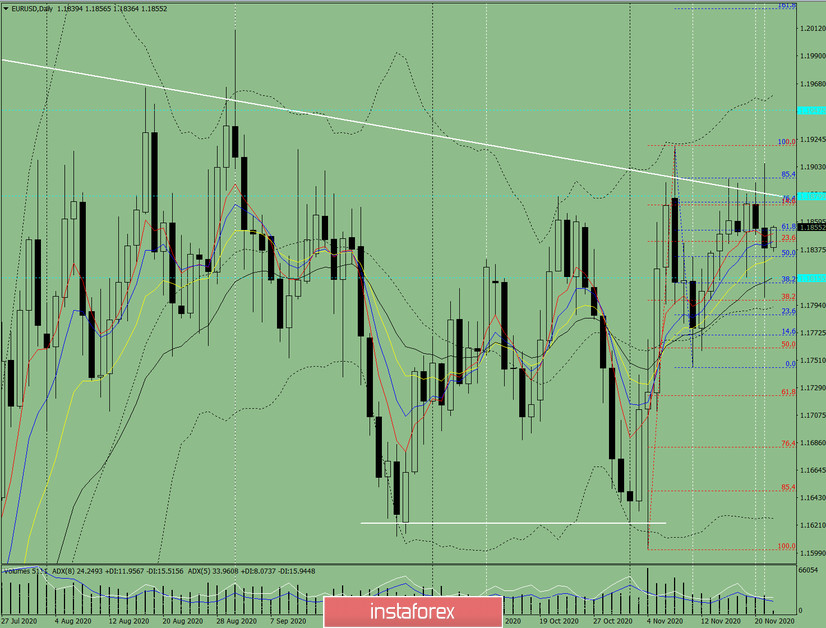
Figure 1 (daily chart).
Comprehensive analysis:
- Indicator analysis - up;
- Fibonacci levels - up;
- Volumes - up;
- Candlestick analysis - up;
- Trend analysis - up;
- Bollinger bands - up;
- Weekly chart - up.
General conclusion:
Today, from the level of 1.1839 (closing of yesterday's daily candlestick), the price can continue to move upward with the target of the 1.1880 resistance line (white bold line). After testing this line, the price will continue to work up with the target of 1.1920 - the upper fractal (red dotted line).
Unlikely scenario: when working up after reaching the pullback level of 76.4% - 1.1875 (blue dotted line), the price is likely to work downward with the goal of 1.1798 - the rollback level of 38.2% (red dotted line).