 English
  Русский
 Bahasa Indonesia
 Bahasa Malay
 ไทย
ไทย Español
 Deutsch
 Български
 Français
 Tiếng Việt
 中文
中文 বাংলা
বাংলা हिन्दी
 Čeština
 Українська
 Română

Yesterday, the pair moved up and tested the historical resistance level at 1.3393 (blue dotted line) and then went down and closed at the level of 1.3321. Today, the upward movement may continue. News on the market is expected at 15:00 UTC (USD) .
Trend analysis (Fig. 1)
Today, the market will try to continue moving up from the level of 1.3321 (the closing of yesterday's daily candle) with the goal of 1.3393 which is the historical resistance level (blue dotted line). If this level is reached, continue working up with the target 1.3436 target level of 161.8% (blue dotted line).
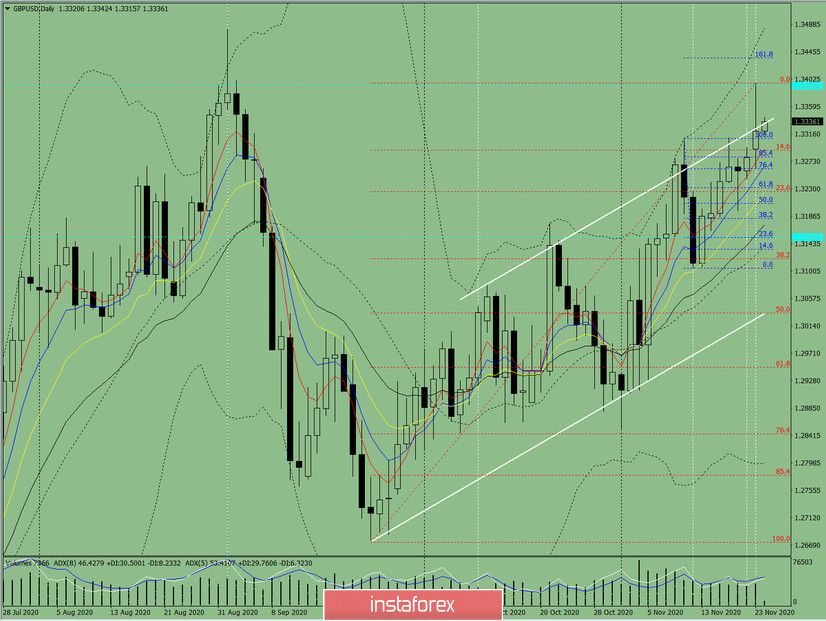
Figure 1 (daily chart).
Complex analysis:
- Indicator Analysis – up
- Fibonacci Levels – up
- Volumes – up
- Candle Analysis – up
- Trend Analysis – up
- Bollinger Bands – up
- Weekly Chart – up
General conclusion:
Today, from the level of 1.3321 (the closing of yesterday's daily candle) the price will try to continue moving up with the goal of 1.3393 which is the historical resistance level (blue dotted line). If this level is reached, continue working up with the target 1.3436 target level of 161.8% (blue dotted line).
Unlikely scenario: An upward movement with a target of 1.3336 is the resistance line (white bold line). If this line is reached, work down with the target of 1.3290 to roll back the level of 14.6% (red dotted line).