 English
  Русский
 Bahasa Indonesia
 Bahasa Malay
 ไทย
ไทย Español
 Deutsch
 Български
 Français
 Tiếng Việt
 中文
中文 বাংলা
বাংলা हिन्दी
 Čeština
 Українська
 Română

Trend analysis (Fig. 1).
Today, the market will try to continue moving upward from the level of 1.3357 (closing of yesterday's daily candle) in order to reach the upper fractal-1.3396 (daily candle from 11/23/2020). If this level is tested, there should be further upward movement with the goal of 1.3436, which is the target level of 161.8% (blue dotted line).
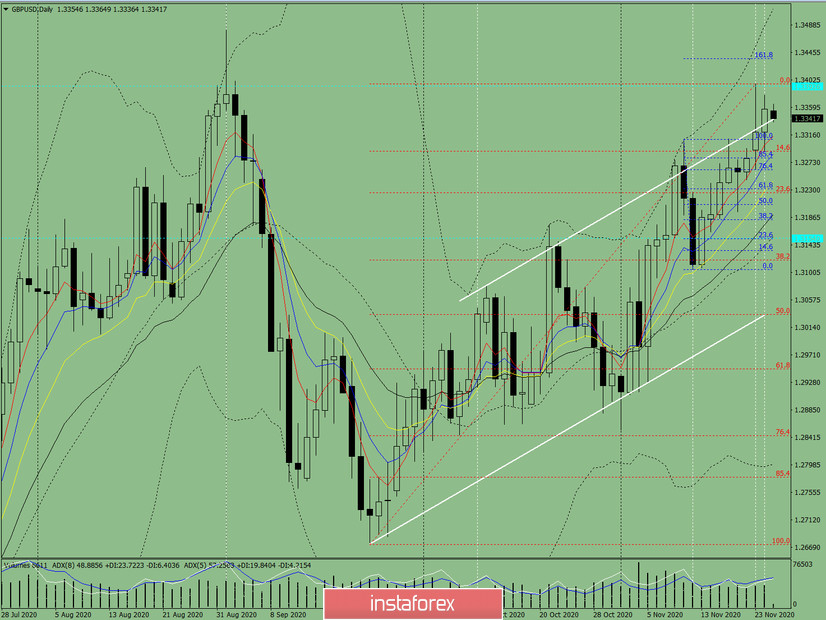
Figure 1 (daily chart).
Comprehensive analysis:
- Indicator analysis - up;
- Fibonacci levels - up;
- Volumes - up;
- Candlestick analysis - down;
- Trend analysis - up;
- Bollinger bands - up;
- Weekly chart - up.
General conclusion:
Today, the price from the level of 1.3357 (closing of yesterday's daily candle) will try to continue moving upward to reach the upper fractal of 1.3396 (daily candle from 11/23/2020). If this level is tested, there should be further upward movement with the goal of 1.3436, which is the target level of 161.8% (blue dotted line).
Unlikely scenario: from the level of 1.3357 (closing of yesterday's daily candle), the price will try to start moving downward with the goal of reaching the pullback level of 14.6% - 1.3290 (red dotted line). If this level is tested, it is necessary to continue working downward to the target of 1.3225, which is the pullback level of 23.6% (red dotted line).