 English
  Русский
 Bahasa Indonesia
 Bahasa Malay
 ไทย
ไทย Español
 Deutsch
 Български
 Français
 Tiếng Việt
 中文
中文 বাংলা
বাংলা हिन्दी
 Čeština
 Українська
 Română

Yesterday, the pair went up and tested the historical resistance level of 1.3393 (blue dotted line), then the market slightly rolled back closing the daily candle at 1.3381. Today, the price may continue to go up and the economic calendar news is not expected.
Trend analysis (Fig. 1).
Today, the market will continue to go up from the level of 1.3381 (closing of yesterday's daily candle) with the goal of 1.3436 at the target level of 161.8% (blue dotted line). After testing this line, it is possible to go down with a target of 1.3291, a pullback level of 14.6% (red dotted line).
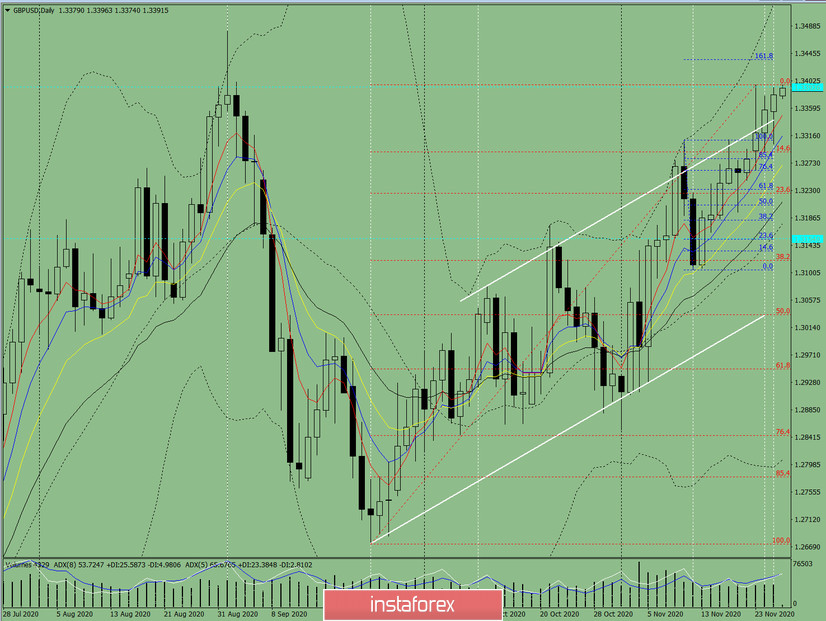
Figure 1 (daily chart).
Complex Analysis:
- Indicator Analysis - up
- Fibonacci levels - up
- Volumes - up
- Technical Analysis - down
- Trend analysis - up
- Bollinger Bands - up
- Weekly Chart - up
General Conclusion:
Today, the price) will continue to go up from the level of 1.3381 (closing of yesterday's daily candle) with the goal of 1.3436 at the target level of 161.8% (blue dotted line). After testing this line, it is possible to go down with a target of 1.3291, a pullback level of 14.6% (red dotted line).
Alternative scenario: if the market goes up and reaches the historical resistance level of 1.3393 (blue dotted line), it can go down with the target of 1.3290 – a pullback level of 14.6% (red dotted line).