 English
  Русский
 Bahasa Indonesia
 Bahasa Malay
 ไทย
ไทย Español
 Deutsch
 Български
 Français
 Tiếng Việt
 中文
中文 বাংলা
বাংলা हिन्दी
 Čeština
 Українська
 Română

To open long positions on EURUSD, you need:
In my morning forecast, I paid attention to purchases from the level of 1.1964, which happened. Data on activity in the manufacturing sector for the Eurozone countries proved to be versatile. For example, in Spain and France, the indices moved to the side below the level of 50, which separates the growth of activity from its reduction. At the same time, in Italy and Germany, the indices remained above 50, signaling some improvement in the situation. Let's look at the 5-minute chart and see how the market reacts. The breakout and consolidation above the resistance of 1.1964 with its top-down test (I highlighted the entry zone on the chart) formed a convenient entry point for long positions, which led to further recovery of the euro. However, the growth was not as long as we would like and the bulls failed to reach yesterday's high, which is a very worrying sign indicating the end of the bullish trend in the short term. Weak inflation in the Eurozone, which turned out to be worse than economists' forecasts, forced euro buyers to retreat.
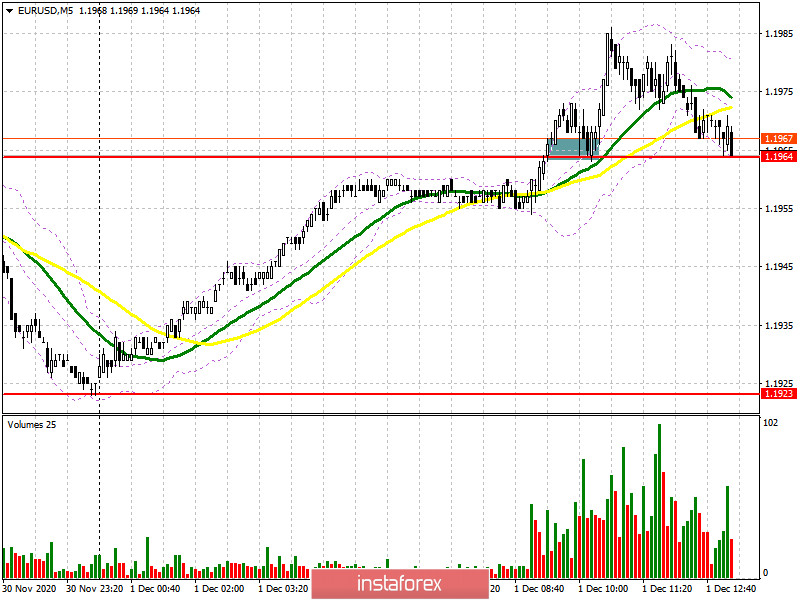
In the second half of the day, buyers of the European currency need to think carefully about protecting the support of 1.1964, as a lot depends on it. Only the formation of a false breakout there with a return to this level will keep the hope of restoring EUR/USD to the area of yesterday's high of 1.2000, the break of which will provide a larger uptrend to the area of 1.2029 and 1.2057, where I recommend fixing the profits. If similar data on the US economy turns out to be better than economists' forecasts, the pressure on the euro will continue in the second half of the day. If there is no activity on the part of the bulls at the level of 1.1964, it is best not to rush with purchases, but wait for yesterday's low to be updated in the area of 1.1923, where the first test will lead to a slight rebound of the pair by 15-20 points within the day. It will be possible to count on a larger movement from this level only if a false breakout is formed there. If buyers are not noticeable in the area of 1.1923, then I recommend opening long positions immediately for a rebound from the minimum of 1.1885.
To open short positions on EURUSD, you need to:
Sellers could not cope with the initial task and protect the level of 1.1964. However, negative data on the European economy stopped the bullish momentum that could be observed since the beginning of the Asian session. In the second half of the day, only a consolidation below 1.1964 and its test from the reverse side from the bottom up will form a more convenient entry point for short positions in the expectation of forming a downward correction to the support area of 1.1923. However, a single update to this level will not be enough to resume the bear market. Only a break below 1.1923 will lead to a larger sell-off of the euro to the support area of 1.1885, where I recommend taking the profits. If the bulls are stronger and continue to push the pair up after weak data on activity in the US manufacturing sector, in this case, it is best not to rush into sales, but to wait for the formation of a false breakout in the area of yesterday's high of 1.2000. If there is no bull activity in the area of 1.2000, and given how the market behaves, this cannot be ruled out, I recommend opening short positions immediately for a rebound from the level of 1.2029 and 1.2057, based on a correction of 15-20 points within the day.
Let me remind you that the COT report (Commitment of Traders) for November 24 recorded an increase in long and a reduction in short positions. Buyers of risky assets believe in the continuation of the bull market, and in the breakout of the psychological mark in the area of the 20th figure, which was tested on November 30. Thus, long non-profit positions rose from the level of 203,551 to the level of 206,354, while short non-profit positions decreased to the level of 68,104, from the level of 69,591. Total non-commercial net position rose to the level 138,250 against 133,960 a week earlier. It is worth paying attention to the growth of the delta after its 8-week decline, which indicates a clear advantage for buyers and a possible resumption of the medium-term upward trend for the euro. It will be possible to talk about a larger recovery only after European leaders agree with the UK on a new trade agreement. Otherwise, we will have to wait for the lifting of restrictive measures imposed due to the second wave of coronavirus in many EU countries and expect that the European Central Bank will not introduce negative interest rates at the December meeting.
Signals of indicators:
Moving averages
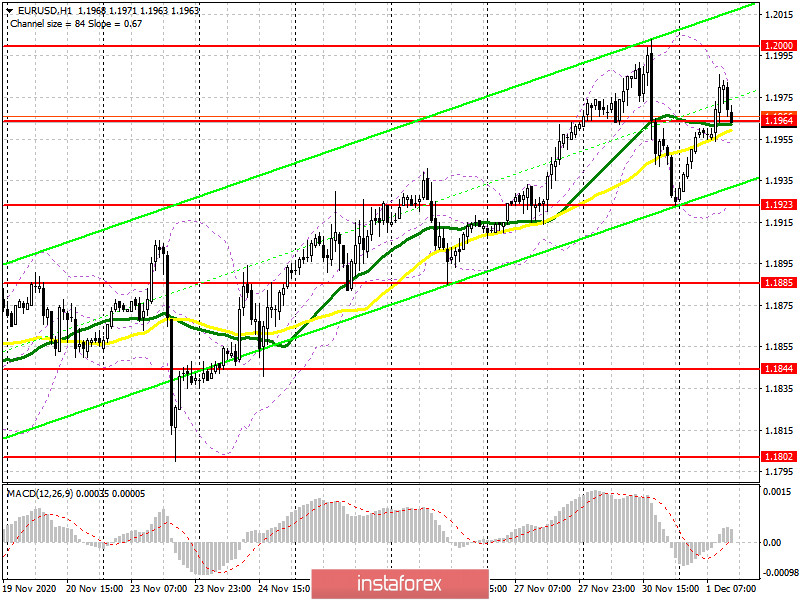
Trading is conducted around 30 and 50 daily moving averages, which indicates the sideways nature of the market and the probability of ending the bullish trend.
Note: The period and prices of moving averages are considered by the author on the hourly chart H1 and differ from the general definition of classic daily moving averages on the daily chart D1.
Bollinger Bands
A break of the upper limit of the indicator around 1.1984 will lead to new growth of the pair. In the case of the first fall of the pair, the lower border of the indicator around 1.1923 will provide support.
Description of indicators
- Moving average (moving average determines the current trend by smoothing out volatility and noise). Period 50. The graph is marked in yellow.
- Moving average (moving average determines the current trend by smoothing out volatility and noise). Period 30. The graph is marked in green.
- MACD indicator (Moving Average Convergence / Divergence - moving average convergence / divergence) Fast EMA period 12. Slow EMA period 26. SMA period 9
- Bollinger Bands (Bollinger Bands). Period 20
- Non-profit speculative traders, such as individual traders, hedge funds, and large institutions that use the futures market for speculative purposes and meet certain requirements.
- Long non-commercial positions represent the total long open position of non-commercial traders.
- Short non-commercial positions represent the total short open position of non-commercial traders.
- Total non-commercial net position is the difference between the short and long positions of non-commercial traders.