 English
  Русский
 Bahasa Indonesia
 Bahasa Malay
 ไทย
ไทย Español
 Deutsch
 Български
 Français
 Tiếng Việt
 中文
中文 বাংলা
বাংলা हिन्दी
 Čeština
 Українська
 Română

To open long positions on GBPUSD, you need:
In my morning forecast, I recommended opening short positions when a false breakout is formed in the resistance area of 1.3395, which happened. On the 5-minute chart, the bulls made an unsuccessful attempt to grow above the middle of the side channel of 1.3395. This happened after the release of a good report on activity in the UK manufacturing sector, which turned out to be better than economists' forecasts. A repeated test and a return to the level of 1.3395 formed a convenient entry point for short positions, after which the pound quickly fell to the middle of the channel of 1.3348, allowing it to take about 40 points from the market. The bulls tried to defend the level of 1.3348, but after a small bounce up, the initiative quickly dried up.
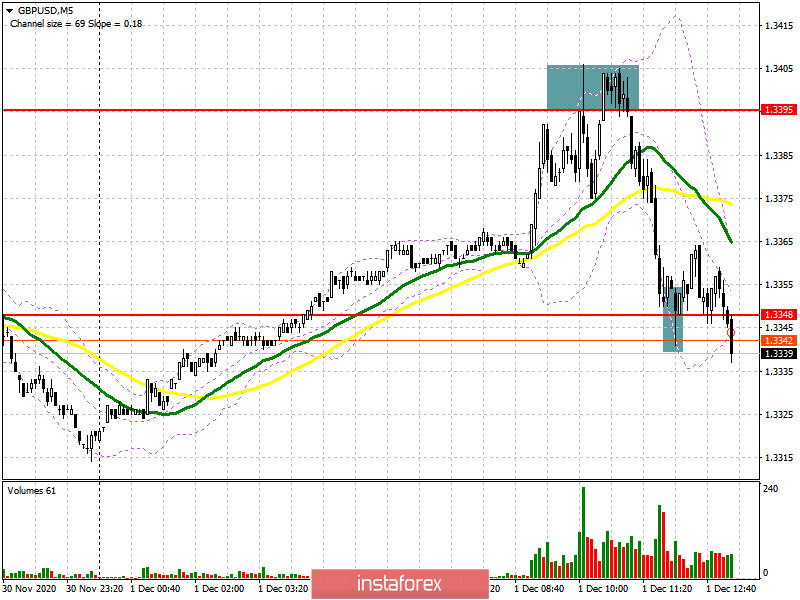
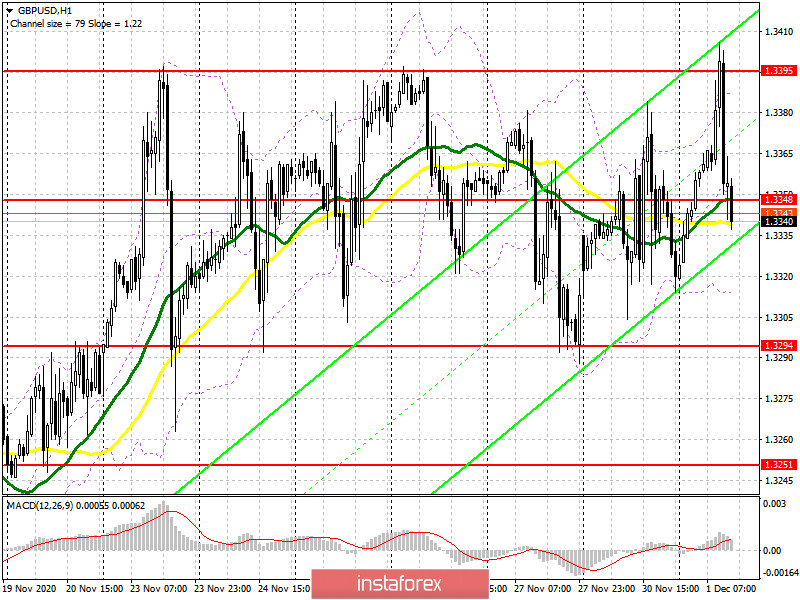
In the second half of the day, the bulls need to protect the resistance of 1.3348, as only this will preserve the probability of further growth of the pound and allow us to count on its exit from the side channel. But something tells us that without news on the trade agreement, we will not go anywhere, and in the US session, we are waiting for a repeat of yesterday, where the pound spent around the level of 1.3348, forming false signals to enter the market. Therefore, be careful and do not rush to enter from the middle of the channel. Only a break and consolidation above 1.3395, along with good news on Brexit, will lead to a new wave of growth of the pound in the area of highs of 1.3453 and 1.3509, where I recommend fixing the profits. In the scenario of a decline in the pound in the second half of the day, the bulls will try to protect the support of 1.3294, which is the lower border of the side channel. You can open long positions from there when a false breakout is formed there, as was the case with sales today from the resistance of 1.3395. If there is no activity in this range, it is best to postpone purchases until the new low around 1.3251 is updated or buy GBP/USD immediately for a rebound from the low of 1.3194, based on an upward correction of 20-30 points within the day.
To open short positions on GBPUSD, you need:
Sellers perfectly coped with the morning task and managed to protect the resistance of 1.3395, from which a sell signal for the pound was formed. Their nearest task is a minimum of 1.3348, fixing under which will lead to a fairly quick sale of GBP/USD already in the area of 1.3294, where I recommend fixing the profits. Without negative news on the trade agreement, it is unlikely that the bears will be able to get below 1.3294. This is why it is so important for sellers to break this low, which will open a direct path for GBP/USD to the area of 1.3251 and 1.3194, where I recommend fixing the profits. If there is no bear activity in the middle of the channel, GBP/USD may return to the upper border of the side channel 1.3395. In this scenario, you can still open short positions after forming a false breakout. If it is not there, and the bulls get above 1.3395, it is best to postpone sales until the test of a new high of 1.3453, from where you can open short positions immediately on the rebound in the expectation of a downward correction of 25-30 points within the day.
Let me remind you that in the COT reports (Commitment of Traders) for November 24, there was an increase in long positions and a small influx of short ones. Long non-commercial positions increased from 27,454 to 30,838. At the same time, short non-commercial positions increased only slightly, from 47,200 to 47,968. As a result, the negative non-commercial net position was -17,130 against -19,746 weeks earlier. Of course, all this speaks to the maintenance of control by the sellers of the British pound and their advantage in the current situation, however, the market is beginning to gradually come back to risks, and reaching a trade agreement will help it in this.
Signals of indicators:
Moving averages
Trading is conducted around 30 and 50 daily averages, which indicates the sideways nature of the market.
Note: The period and prices of moving averages are considered by the author on the hourly chart H1 and differ from the general definition of classic daily moving averages on the daily chart D1.
Bollinger Bands
A break of the lower limit of the indicator around 1.3320 will lead to a new wave of falling of the pound. A break of the upper limit in the area of 1.3385 will form a new upward trend.
Description of indicators
- Moving average (moving average determines the current trend by smoothing out volatility and noise). Period 50. The graph is marked in yellow.
- Moving average (moving average determines the current trend by smoothing out volatility and noise). Period 30. The graph is marked in green.
- MACD indicator (Moving Average Convergence / Divergence - moving average convergence / divergence) Fast EMA period 12. Slow EMA period 26. SMA period 9
- Bollinger Bands (Bollinger Bands). Period 20
- Non-profit speculative traders, such as individual traders, hedge funds, and large institutions that use the futures market for speculative purposes and meet certain requirements.
- Long non-commercial positions represent the total long open position of non-commercial traders.
- Short non-commercial positions represent the total short open position of non-commercial traders.
- Total non-commercial net position is the difference between the short and long positions of non-commercial traders.