 English
  Русский
 Bahasa Indonesia
 Bahasa Malay
 ไทย
ไทย Español
 Deutsch
 Български
 Français
 Tiếng Việt
 中文
中文 বাংলা
বাংলা हिन्दी
 Čeština
 Українська
 Română

To open long positions on GBP/USD, you need:
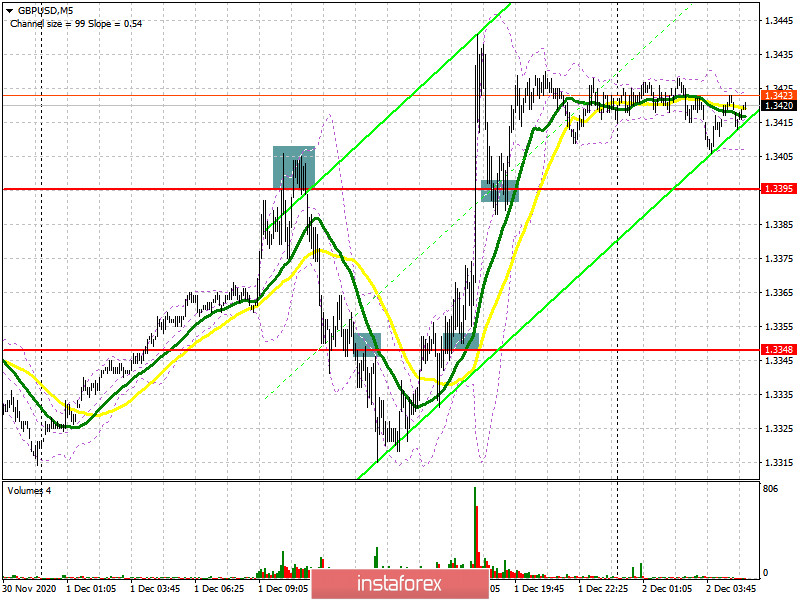
In my morning forecast, I advised you to open short positions when a false breakout forms in the resistance area of 1.3395, which is what happened. If you look at the 5-minute chart, you can see how the bulls made an unsuccessful attempt to rise above the midpoint of the 1.3395 horizontal channel, which produced a convenient entry point into short positions and a rapid fall to the support area of 1.3348. By the middle of the European session, the bears broke through this range and tested it from the bottom up, after which I also advised you to sell the pound (I mentioned this scenario in yesterday's afternoon forecast), which caused the pound to fall by another 30 points. A sharp return to the 1.3348 range during the US session and testing this level from top to bottom produced a convenient entry point for long positions, after which we could watch a breakout of the weekly resistance at 1.3395 and the pound being able to settle above this level.
Despite such active purchases on the pound and a breakout of 1.3398, everything will still depend on whether we will be pleased with the upcoming Brexit news or not. Given the intensity of the negotiations and the fact that the deadlines are coming to an end, the pound's volatility will remain quite high. The bulls need to protect support at 1.3398, and forming the next false breakout on it will be a signal to open long positions in order to sustain the pound's growth in the short term, thereby reaching a high of 1.3453. A breakout of this range will depend on news on the trade deal. If a compromise is reached, a breakout and getting the pair to settle above 1.3453 will lead to another signal to open long positions in order to bring back GBP/USD to the highs of 1.3509 and 1.3563, where I recommend taking profits. If bulls are not active in the 1.3398 support area, it is best to abandon short positions before updating the 1.3348 low, from which buyers formed a good bullish momentum yesterday. You can also buy GBP/USD on a rebound from a low of 1.3294, counting on a correction of 20-30 points within the day.
To open short positions on GBP/USD, you need:
Sellers of the pound need to return resistance at 1.3398. Nothing good is in store for them while trade occurs above this range. Getting the pair to settle below 1.3398 and testing it from the bottom up produces a good entry point for short positions, as we aim to fall to the support area of 1.3348, where the moving averages are. The next target will be a large level at 1.3294, where I recommend taking profits. Protecting resistance at 1.3453 is also an important task. Forming a false breakout there will be another signal to sell the pound, but of course a larger bearish momentum will be present only if we receive bad news on the trade agreement. If sellers are not active in the 1.3453 area and the pound further moves up, I recommend abandoning short positions until the 1.3509 high has been updated, or sell the pound immediately on a rebound in the 1.3563 area, counting on a correction of 20-30 points within the day.
The Commitment of Traders (COT) report for November 24 showed an increase in long positions and a small inflow of short ones. Long non-commercial positions increased from 27,454 to 30,838. At the same time, short non-commercial positions only slightly grew, from 47,200 to 47,968. As a result, the negative non-commercial net position was -17,130, against - 19,746 a week earlier. This indicates that sellers of the British pound retain control and it also shows their slight advantage in the current situation, but the market is beginning to gradually come back to risks, and reaching a trade deal will help it in this.
Indicator signals:
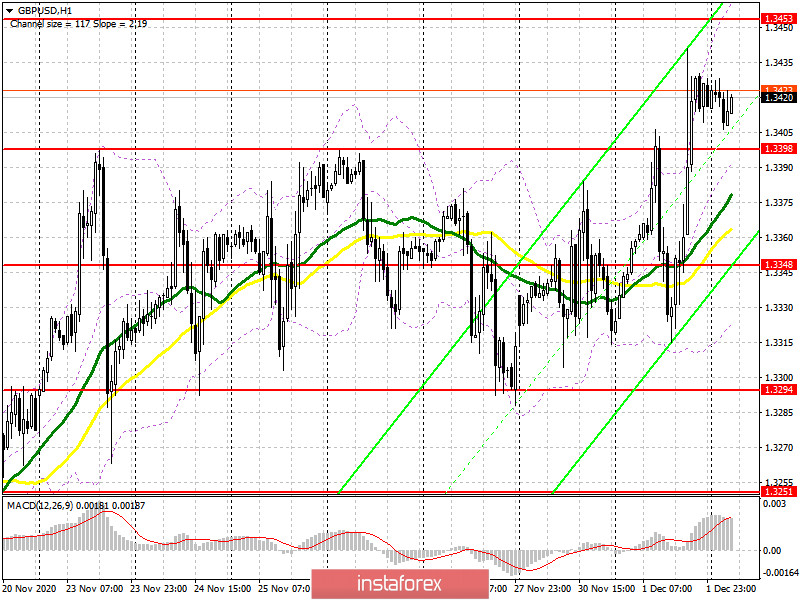
Moving averages
Trading is carried out just above the 30 and 50 moving averages, which indicates an attempt by the bulls to bring back the pound's growth
Note: The period and prices of moving averages are considered by the author on the H1 hourly chart and differs from the general definition of the classic daily moving averages on the daily D1 chart.
Bollinger Bands
A breakout of the upper border of the indicator around 1.3453 will lead to a new wave of growth for the pound. A breakout of the average border of the indicator in the 1.3398 area will increase the pressure on the pair.
Description of indicators
- Moving average (moving average, determines the current trend by smoothing out volatility and noise). Period 50. It is marked in yellow on the chart.
- Moving average (moving average, determines the current trend by smoothing out volatility and noise). Period 30. It is marked in green on the chart.
- MACD indicator (Moving Average Convergence/Divergence — convergence/divergence of moving averages) Quick EMA period 12. Slow EMA period to 26. SMA period 9
- Bollinger Bands (Bollinger Bands). Period 20
- Non-commercial speculative traders, such as individual traders, hedge funds, and large institutions that use the futures market for speculative purposes and meet certain requirements.
- Long non-commercial positions represent the total long open position of non-commercial traders.
- Non-commercial short positions represent the total short open position of non-commercial traders.
- Total non-commercial net position is the difference between short and long positions of non-commercial traders.