 English
  Русский
 Bahasa Indonesia
 Bahasa Malay
 ไทย
ไทย Español
 Deutsch
 Български
 Français
 Tiếng Việt
 中文
中文 বাংলা
বাংলা हिन्दी
 Čeština
 Українська
 Română

EUR/USD 15M
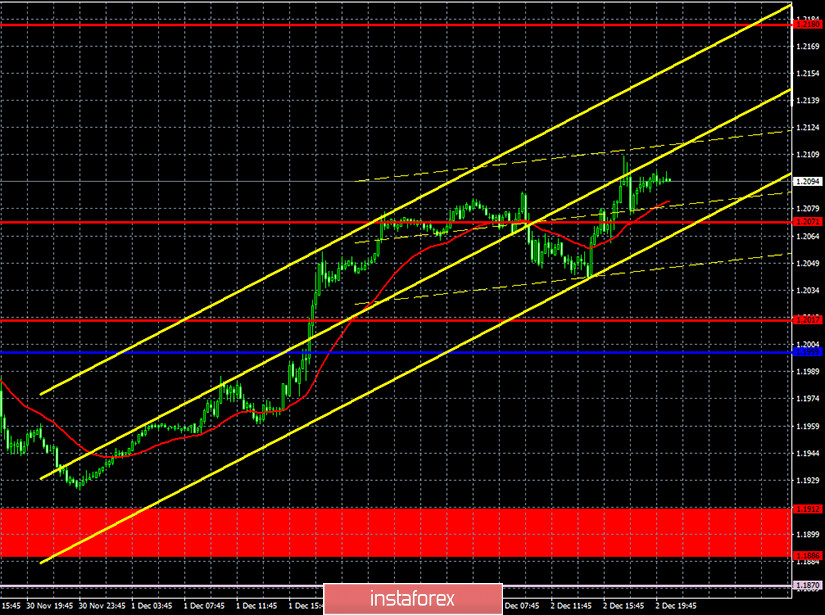
The linear regression channels are directed to the upside on the 15-minute timeframe, which is not surprising, since the upward movement is still present despite all of the technical and fundamental factors. Traders managed to overcome the 1.2071 level, so growth may persist in the coming days.
EUR/USD 1H
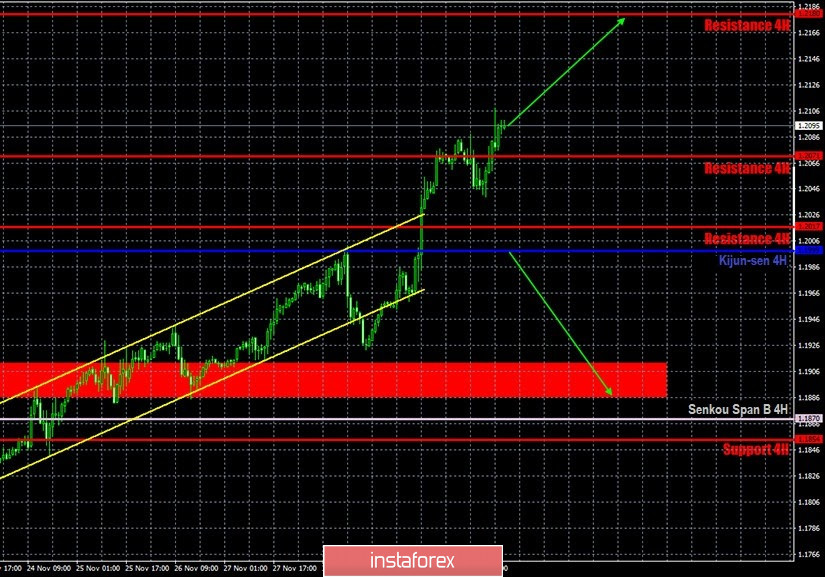
The EUR/USD pair slightly corrected on the hourly timeframe on Tuesday, December 1 after rising on Monday, and then it went back to moving up as if nothing happened, breaking the previous day's highs as well as two-year highs. Therefore, absolutely illogical upward movement is still present. The ascending channel does not matter anymore, since the price went slightly below it, and now it is located much higher than it. What is the essence of a channel if the pair is not traded within it? Moreover, there are no technical guidelines now. Yesterday's upward movement could not be identified in any way. There was neither a rebound from an important line/level, nor a breakdown of an important line/level. Thus, after staying in one place for four months, the pair has been breaking all growth records for a week. We still believe that the euro's growth is absolutely groundless, but at the same time, we recommend trading upward, since the upward trend is clearly visible.
COT report
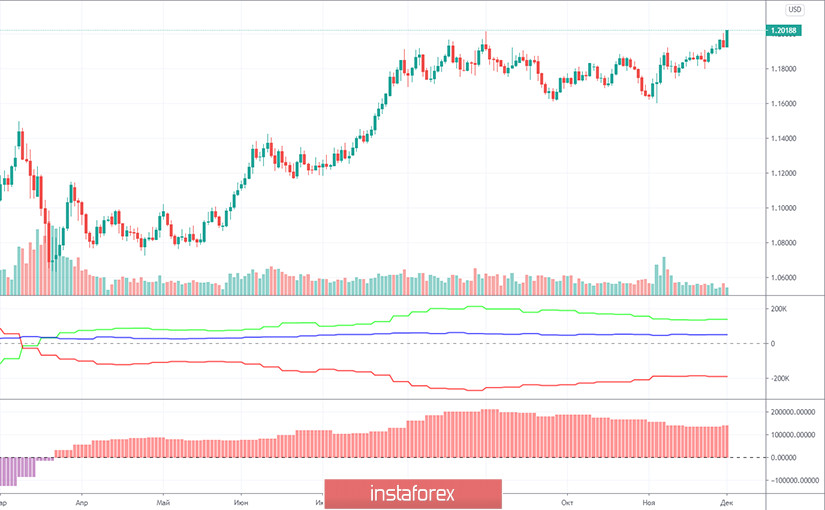
The EUR/USD pair fell by 10 points in the last reporting week (November 17-23). That is, the price changes were again minimal. This indicates a low activity from traders, primarily large traders, whose deals are displayed in the Commitment of Traders (COT) reports. What did the new report show us? Very little. As in the previous week, professional traders opened a small number of new contracts during the week, only about 3,700. Considering that the total number of contracts for the "non-commercial" group is more than 300,000, this means that 3,700 is only about 1%.
However, this time, despite the absence of price changes, professional traders became more bullish. Moreover, for 5,000 contracts at once. This is how the net position changed for the group of non-commercial traders, because in addition to the 3,000 Buy-contracts (longs) that are open, there were also 2,000 Sell-contracts (shorts) that were closed. So, quite unexpectedly, non-commercial traders began to increase their purchases of the euro after at least two months of their reduction. Don't jump to conclusions. So far, it's only been a week. Although, as we can see, according to the subsequent trades, the euro has significantly grown in price. The green and red lines began to diverge again on the first indicator. The second indicator started to show growth. Therefore, based on the latest COT report, we can conclude that the upward trend is resuming. However, we still advise you to be prepared for a possible new downward reversal.
The European Union published a relatively important report on unemployment rate, which reached 8.4% in October. This is a fairly high value. However, market participants (probably) attached greater importance to the ADP report on the change in the number of employed in America, which turned out to be much worse than the forecast value and only reached +307,000. report. However, we would like to remind traders that the euro has been growing non-stop for a week now, and there weren't any reasons for its growth every day. More precisely, almost none at all. Thus, yesterday's report from ADP looks more like an attempt to explain, than a real reason why the dollar fell.
The EU countries are set to publish indexes of business activity in the service sectors, and market participants can once again be convinced that the service sector began to suffer losses with the beginning of the second lockdown and these losses will certainly affect the final GDP. A report on retail sales in the European Union for the month of October will also be released on Thursday. Although these are not the most important indicators, they still show that things are far from good in Europe now. Consequently, there are still no macroeconomic reasons for the euro's growth. There are also no fundamental reasons, since the European economy risks losing a few more percent of GDP in the fourth quarter. But the US does not at the moment.
We have two trading ideas for December 3:
1) Buyers continue to move up. Therefore, you are advised to continue trading upward while aiming for the resistance level of 1.2180. However, there are few guidelines for maintaining the upward trend. The pair managed to leave the ascending channel, so you can only start from the position of the Kijun-sen line (1.1999). But the price will not correct exactly to this line every time. Take Profit in this case can range from 80 points.
2) Bears are releasing the pair from their hands more and more every day, nevertheless, the current fundamental background allows them to count on a downward reversal in the near future. Thus, it is recommended to open sell orders with the first target at 1.1886 in case the price settles below the Kijun-sen line (1.1999). Take Profit in this case can be up to 100 points.
Forecast and trading signals for GBP/USD
Explanations for illustrations:
Support and Resistance Levels are the levels that serve as targets when buying or selling the pair. You can place Take Profit near these levels.
Kijun-sen and Senkou Span B lines are lines of the Ichimoku indicator transferred to the hourly timeframe from the 4-hour one.
Support and resistance areas are areas from which the price has repeatedly rebounded off.
Yellow lines are trend lines, trend channels and any other technical patterns.
Indicator 1 on the COT charts is the size of the net position of each category of traders.
Indicator 2 on the COT charts is the size of the net position for the "non-commercial" group.